
What Is Tokenomics? Beginner’s Guide


Key Takeaways
- Tokenomics is not a price predictor. It is the rule-set governing supply, distribution, utility, incentives, and governance — the mechanics that create (or destroy) long-run sustainability.
- Market cap can mislead. Two tokens can share the same market capitalization while carrying radically different dilution profiles due to unlocks, emissions, and low circulating supply.
- Unlock schedules are often the highest-impact variable. A cliff unlock into thin liquidity is one of the cleanest structural risk setups in crypto markets.
- Utility and incentives are opposites in value flow. Utility pulls demand; incentives push supply. Both can exist — confusing them leads to inflated fundamental claims.
- On-chain verification beats documentation. If contract permissions, mint roles, and vesting mechanics are not verifiable on a block explorer, you are relying on social commitments.
Scope & Limitations
- Not financial or legal advice. Tokenomics analysis describes economic design; it does not predict price.
- Tokenomics ≠ technical analysis. Price charts reflect market sentiment; tokenomics is the rule-set and incentive design that operates beneath price action.
- Parameters change. On-chain variables — including supply distribution rules and token unlock schedules — can be modified through governance. Always verify current figures against live sources.
For something so crucial for evaluating a crypto project, tokenomics is a term too often misunderstood or not given clear enough definition. What does “token economics” even mean? Tokenomics is the economic logic governing a cryptocurrency project's supply dynamics, distribution, utility, incentives, and governance — the full rule-set that determines how a token is created, allocated, and sustained over time.
It directly shapes outcomes investors and builders care about: dilution risk from inflationary supply schedules, whether incentive structures align contributors with long-term protocol health, and whether a project's economic model is sustainable beyond its initial launch. A token's market capitalization and circulating supply are surface-level signals but tokenomics is the architecture underneath them.
Definition of Tokenomics
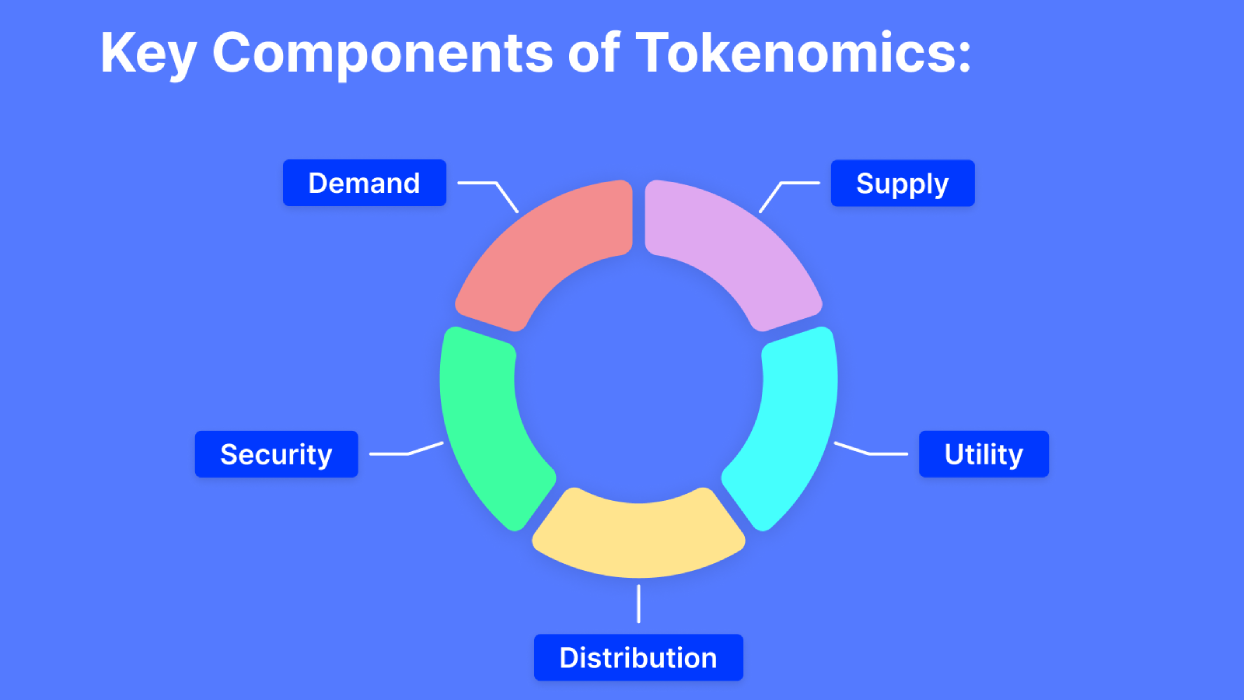
Admittedly, “token economics” is a phrase that can mean a lot of things: is it about the use case? The monetary dynamics? What makes a token valuable? And most often, all of it is rolled into the definition.
Most commonly, tokenomics defines the rules governing a token's supply, distribution, and utility within a blockchain protocol. It encompasses the economic logic behind how tokens are created, allocated, and used—covering supply dynamics, inflation or deflation, emissions schedules, and incentive design built directly into the protocol layer.
So, we understand tokenomics as a specific, bounded discipline. It covers protocol-level token rules and incentive design — the mechanics written into a project's smart contracts and whitepaper. It does not include price action or technical analysis (chart patterns, support/resistance levels), general project fundamentals unrelated to token rules (such as a product roadmap or team credibility assessments), or off-chain factors like marketing campaigns and community hype. If it isn't a token rule or an on-chain incentive structure, it falls outside tokenomics.
Academic framing treats tokenomics as the economic logic governing supply, distribution, utility, and governance — the structural layer that determines how a cryptocurrency network sustains participation over time. Some definitions of tokenomics shift the focus away from supply dynamics toward incentives and value drivers (a noteworthy example is provided by Hacken). In practice, tokenomics commonly includes market capitalization, supply dynamics (inflation/deflation), supply distribution, and utility, as outlined in foundational resources on the subject (Coinbase; Frontiers in Blockchain), and in this guide we will stick to the definition that is more widespread simply to cover more ground.
Key Parts of Tokenomics
Four levers determine a token's economics — each one gives you a diagnostic framework for evaluating any cryptocurrency project even before the deeper analysis begins. Tokenomics commonly includes market capitalization alongside supply/inflation/deflation metrics, distribution, and utility — which is exactly why you see all of these figures grouped together on crypto dashboards and in a project's whitepaper.
Supply
Supply as a broad term describes what tokens exist and how that quantity changes over time. The core distinction here is between stock variables — what exists right now (circulating supply, total supply) — and flow variables — what changes over time (new issuance, burns, unlocks). Stock variables give you a snapshot; flow variables tell you where the snapshot is heading.
If flow variables consistently add tokens to circulating supply faster than demand grows, holders face dilution and inflation risk. Evaluate it by examining:
- Max supply — is there a hard cap, or is issuance open-ended?
- Circulating supply vs. total supply — how much is already in the market?
- Inflation rate — at what rate are new tokens entering circulation?
- Deflation mechanisms — is there a burn mechanism reducing supply over time?
- Fully-diluted market capitalization — what does market cap look like if all tokens are issued?
Distribution
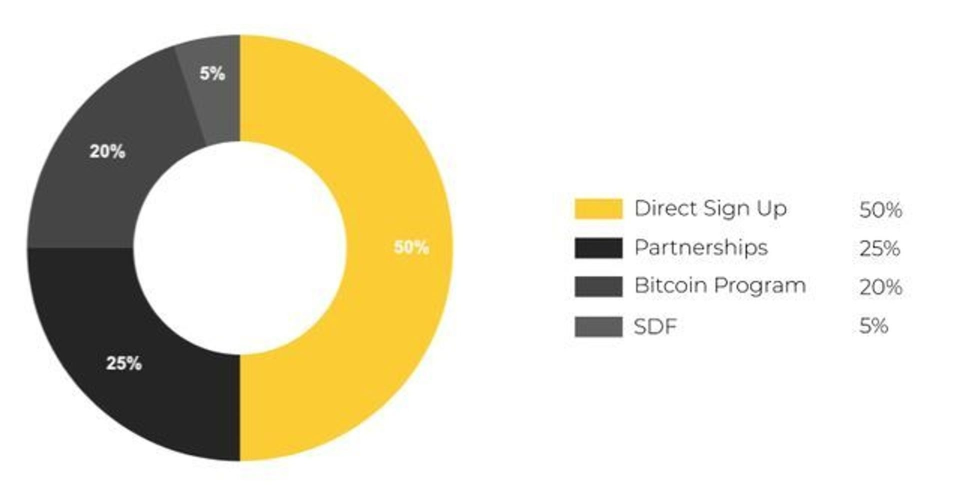
Next comes the question of where will the supply move or where does it stay. Supply allocation — who received tokens and on what terms — shapes who holds power in a network, among other things. A project can have sound supply mechanics and still be structurally fragile if tokens are concentrated in a few hands. You can tell this is or is not happening by looking at:
- Insider allocation — what percentage went to team, investors, and advisors?
- Token unlock schedule — when do locked tokens become liquid and tradable?
- Vesting period — how long are insiders required to hold before selling?
- Treasury control — how large is the protocol treasury, and who governs it?
- Public/community allocation — what share was distributed to non-insiders?
High insider allocation or whale concentration can mean a small group controls governance votes, liquidity, or sell pressure. Treasury size and control structure matter too — a large treasury governed by a narrow set of addresses is a centralization risk even if public supply looks healthy. Vesting and unlock schedules are the key variable to watch, because concentration that looks acceptable today can shift dramatically when a cliff unlock hits.
Utility
Utility answers the question: what do you actually do with the token? Without genuine use cases, demand is purely speculative — it has its place but ultimately, speculative demand is fragile.
The language describing the utility of a token is usually front and center in crypto whitepapers or documentation, but it may still be of little substance. What you should be looking for in particular is:
- Required/consumptive demand — must users spend or burn the token to access the protocol (e.g., gas fees, burn-on-use)?
- Optional demand — does holding the token unlock discounts, features, or access tiers?
- Governance — does the token carry voting rights, and is that governance premium real?
- Collateral use — can the token be used as collateral in DeFi protocols?
- On-chain usage metrics — do transaction volume and active addresses confirm real product dependency?
Incidentally, those factors are the demand drivers we already spoke about. However, a token having a concrete use case is still not enough to make it worthwhile: if it is more economical to sell a governance or gas token than to actually use it, expect the holders to do exactly that.
Incentives
What we just described is a case of misaligned incentives. Incentives are what users are paid to do — staking rewards, liquidity mining, referral bonuses, and similar token-based incentive programs. They are powerful for bootstrapping behavior, but they carry a structural warning that every tokenomics analysis must address.
Too often in the crypto space incentives create more supply. Staking rewards, liquidity incentives, and user rewards all increase circulating supply, even if the total is limited. They can also attract mercenary capital — participants who provide liquidity or stake tokens only as long as rewards are high, and exit the moment yields compress. This dynamic can amplify volatility and leave protocols hollowed out after an incentive program ends.
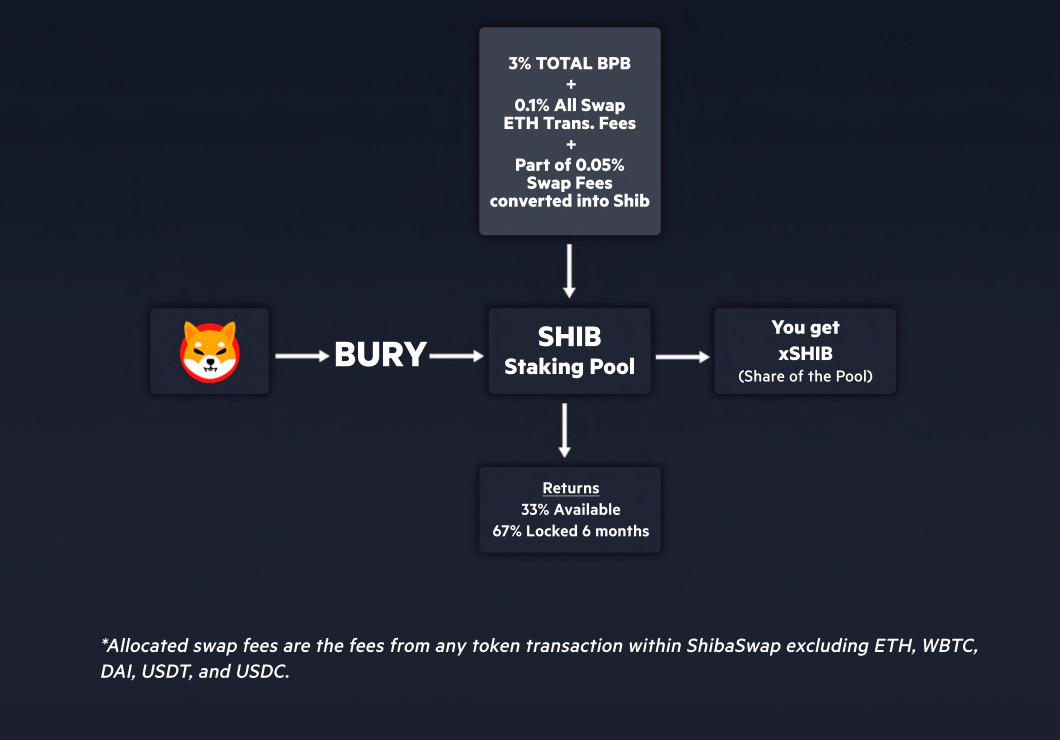
If there is such a program, examine each kind for what it is:
- Staking rewards — what is the annual yield, and where do those tokens come from?
- Liquidity incentives — is the protocol paying to attract liquidity, and at what cost to supply inflation?
- User incentive programs — are rewards funding genuine adoption or masking weak organic demand?
Who funds the rewards — is it from protocol revenue, or purely from new token issuance? How long is the incentive program designed to run, and what happens when it ends? Is there evidence of retained users and organic activity after previous incentive periods concluded?
Incentives should not be conflated with utility: a staking token is not supposed to be used just for rewards like a yield-bearing asset, its aim is to introduce an economical incentive to secure a network.
Token Supply and Emissions
Circling back to token supply, its different types determine whether a token's inflation rate is expanding or contracting, and understanding both is the foundation for computing dilution, fully-diluted market capitalization, and any forward-looking valuation work.
Total Supply
Total supply equals all tokens currently in existence at a given moment — minted but not yet burned. It covers both circulating and non-circulating supply (anything not yet available to the open market such as locked team allocations, unvested grants, treasury reserves, etc.)
Total supply changes when a mint or burn event occurs: it increases when new tokens are created and decreases when tokens are permanently destroyed or removed from circulation. Some methodologies diverge in whether to count “dead coins” that are stuck on addresses that can no longer be accessed. Total supply can be dynamic even when a max supply exists — the two figures only converge once the final token is minted and no burns are occurring, or when burns have reduced supply below the original cap.
Max Supply
Not to be confused with total, max supply is the hard ceiling on the number of tokens that can ever exist. Bitcoin is known for its 21 million BTC cap. But "max supply" is not a single, uniform concept — it comes in at least three forms, each with different implications for scarcity:
- Hard-coded cap. The ceiling is written into the protocol's base layer and cannot be changed without a hard fork. Bitcoin is the canonical example: the limit is enforced at the consensus level and its halving cadence — cutting block rewards roughly every four years — defines a predictable, decelerating issuance schedule.
- Governance-changeable cap. The ceiling exists at launch but can be raised or lowered through an on-chain governance vote. Polkadot's DOT supply is a practical illustration of evolving issuance policy: its cap was set at 1 billion tokens at genesis, and the community later voted to introduce a disinflationary schedule that caps total supply at approximately 2.1 billion.
- Effectively uncapped. No formal ceiling exists; new tokens can be minted indefinitely, albeit often at a decaying rate. Look no further than Solana.
If a max supply exists, it does not automatically mean an asset is scarce at the moment. A token can have a hard cap but still experience severe early dilution if the majority of its supply enters circulation in the first two years, leaving later participants holding heavily diluted positions.
Circulating Supply

This one is somewhat straightforward for a change. Circulating supply counts only the tokens that are currently tradeable on the open market. Standard accounting practice excludes:
- Vesting and lockup allocations — team, investor, and advisor tokens still under lock
- Treasury and community reserves — tokens held by a foundation or DAO for future deployment
- Escrow holdings — tokens locked in smart contracts for specific future conditions
- Protocol-owned liquidity — tokens the protocol itself holds in liquidity pools or reserves
Naturally, circulating supply drives near-term price impact more directly than total supply because it represents the actual float available for buying and selling. For one, market capitalization is calculated from this figure, and it is the denominator most market participants use when assessing immediate supply pressure.
Emission Schedule
An emission schedule specifies how, when, and to whom new tokens are issued:
| Pattern | Description |
|---|---|
| Fixed | A constant number of tokens emitted per block or epoch indefinitely |
| Declining / Linear decay | Emission rate decreases gradually over time toward zero or a floor |
| Halving / Stepwise | Emission is cut by a fixed fraction at predetermined intervals (e.g., every N blocks) |
| Tail emission | A small, perpetual issuance floor is maintained after the main schedule concludes |
| Adaptive | Emission rate adjusts dynamically based on a network variable (e.g., staking participation ratio) |
Each schedule can be analysed with three questions:
- What is being emitted? Block rewards, staking/validator rewards, liquidity mining incentives, community grants, or a miner reward each have different recipient sets and sell-pressure profiles.
- Who receives the emissions? Validators, stakers, liquidity providers, or a treasury — the recipient class determines how quickly emissions convert into market sell pressure.
- Where is the schedule documented? Start with the project's whitepaper for stated intent, then cross-reference on-chain parameters (governance modules, reward contracts) to verify the schedule is actually being followed.
Analytical tools can present this data in a digestible way but just in case you would like to run the calculations yourself: Identify the time unit first — per block, per epoch, or per day. Then annualize it: annualized inflation rate = (tokens emitted per period × periods per year) ÷ current total supply × 100. This single conversion lets you compare emission aggressiveness across projects on a like-for-like basis.
Minting
The on-chain event that changes the state of the total supply is minting: it creates completely new tokens and assigns them to a specified address. Canonical minting triggers are:
- Genesis allocation. Tokens created at chain launch for founding teams, investors, and the treasury.
- Block / validator rewards. New tokens issued per block as compensation for network security.
- Treasury and community grants. Governance votes authorize new mints to fund development, grants, or ecosystem programs.
- Bridging and wrapping mechanics. Locking a native token on one chain to mint a wrapped version on another effectively introduces new supply into a second market.
- Governance mints. Distinct from treasury grants, these are protocol-level decisions to permanently expand max supply or mint for specific one-time purposes.
Obviously, it is not as simple as “minting=inflation=bad” (see the first point) but poorly calibrated events may seriously damage the supply dynamics.
Burning

Burning should be the opposite of minting but not all burns are equal in mechanism or intent. Three categories apply:
- Discretionary burns (governance-initiated). A DAO or protocol team votes to burn a portion of treasury holdings or a specific reserve. These are one-time or periodic, subject to political process, and not reliably predictable.
- Programmatic burns (fee burn). A portion of transaction fees is automatically destroyed by the protocol with every transaction. These burns are continuous and rule-based, making them more predictable but their magnitude is usage-dependent.
- User-initiated burns (redeem/exit mechanisms). A user burns tokens to redeem an underlying asset, exit a position, or claim a benefit. The burn rate is entirely driven by individual behavior and market incentives.
Net issuance ties all three back to the emission schedule: it’s total emissions (supply) minus the sum of all burned supply. A fee burn reduces circulating supply only if the volume of tokens burned exceeds the volume of new tokens being minted — otherwise, the burn is cosmetically deflationary but mathematically dilutive in net terms.
Token Distribution and Unlocks
Next comes understanding how a token's supply is divided, released, and ultimately controlled is one of the most consequential parts of any tokenomics analysis. The initial allocation sets the starting power structure; vesting and unlock schedules determine when that power can be exercised; and mechanisms like airdrops, staking rewards, and treasury deployments shape how supply enters circulation over time.
Initial Allocation
The initial allocation is the foundational supply distribution: who gets how much at the outset, under what conditions, and where you can verify it. The usual categories to receive starting allocation are:
1. Team / Founders
Usually 10–20% of total supply. These tokens are almost always locked at TGE (Token Generation Event) with a cliff of six months to a year, followed by linear vesting over two to four years.
2. Early Investors / VCs
Typically 15–30% of total supply. Investor tranches are usually locked at TGE with cliff and vesting terms negotiated at the funding round — often shorter than founder schedules.
3. Ecosystem / Community
Often 20–40% of total supply, covering grants, developer incentives, and user rewards. May be partially liquid at TGE (e.g., an initial airdrop tranche) with the remainder released on a long-tail schedule.
4. Liquidity / Market-Making
Typically 3–10%. This allocation funds exchange liquidity pools and market-maker agreements. Whether it is time-locked varies significantly by project — some projects release it fully at TGE, which is a meaningful concentration risk.
5. Treasury / Foundation
Often 15–30% of total supply. These tokens are generally non-circulating at TGE and are held in a foundation or DAO-controlled wallet. They are deployed over time via governance proposals. The treasury wallet address should be publicly disclosed and ideally controlled by a multisig.
Vesting
Vesting governs when allocated tokens actually become transferable. While a lockup is a hard time restriction on transfer and release is when the tokens become transferable, which is clear from the terms, vesting means a schedule that incorporates both timing and releasing.
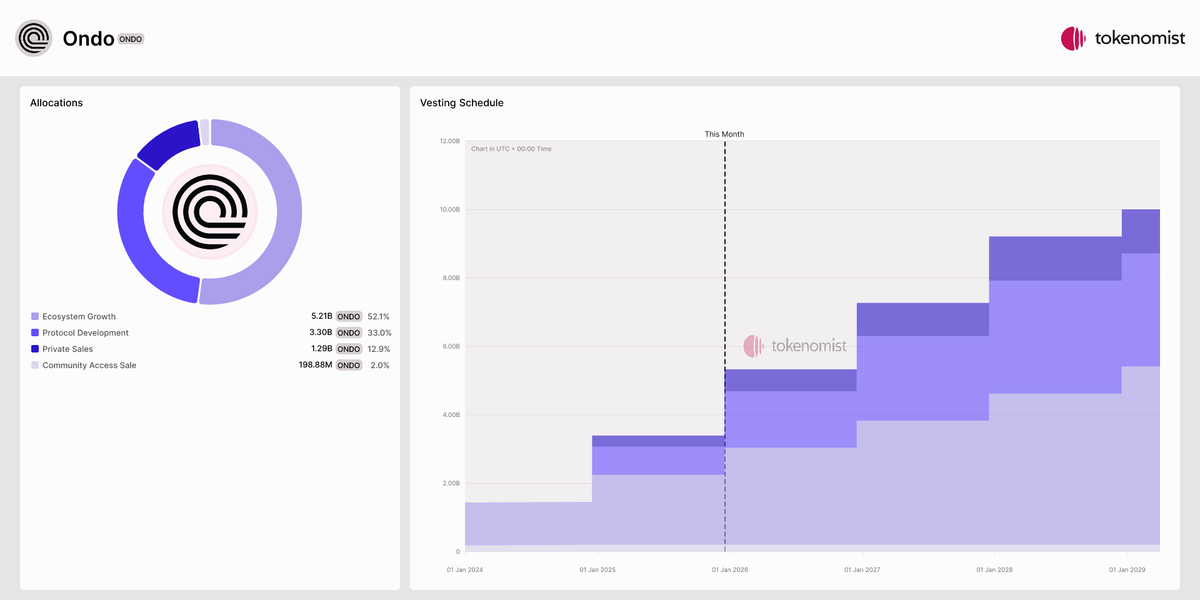
The terminology is used inconsistently across projects, so precise definitions of core primitives matter:
Cliff vesting — Tokens are entirely locked for a defined period (the "cliff"), after which a lump sum becomes transferable at once. The implication here is a predictable, concentrated sell-pressure event at cliff expiry.
Linear vesting — After an optional cliff, tokens unlock continuously (or in frequent small tranches, e.g., daily/monthly) over the vesting period. This way, selling pressure is distributed and more predictable, but ongoing. Lower single-event risk, higher baseline dilution rate.
Graded vesting — Tokens unlock in pre-set percentage increments at defined intervals (e.g., 10% at month 6, 20% at month 12, etc.). In this irregular unlock cadence that requires more attention than simply scanning the headline figure, each step-up date functions as a mini-cliff event.
Milestone-based vesting — Tokens unlock upon achievement of defined project milestones (e.g., mainnet launch, TVL target). Timing of these unlocks is uncertain and may be subject to discretionary interpretation and higher trust requirements for governance or a third-party verifier.
How vesting is enforced matters as much as what the schedule says. Smart contract enforcement is the most transparent. Vesting parameters (start time, cliff duration, total amount, release cadence) are encoded on-chain in an audited vesting contract. Anyone can verify the schedule by reading the contract.
Escrow (third-party custodian) implies that the tokens are held by a legal or technical intermediary. Less transparent than on-chain enforcement; requires trust in the custodian. Finally, centralized custody (project-controlled) when the project itself holds and manually releases tokens according to a stated schedule has the lowest verifiability. The key risk: admin key holder(s) could unilaterally modify the release schedule.
Unlocks
Not all unlocks are structurally equivalent. Depending on the source and recipient, they carry different likely market impact:
| Unlock Type | Typical Recipient | Market Impact Pathway |
|---|---|---|
| TGE unlock | All allocated parties (per schedule) | Immediate circulating supply increase; liquid from day one for unlocked portions |
| Cliff unlock | Team, investors (post-cliff lump sum) | Concentrated sell-pressure event; single date, large volume |
| Periodic vesting unlock | Team, investors, ecosystem (linear/graded) | Distributed, ongoing dilution; lower single-event risk |
| Investor tranche unlock | Early investors / VCs | Often coincides with fund lifecycle pressure to return capital; high sell-probability |
| Ecosystem grant unlock | Grant recipients (developers, DAOs) | Programmatic distribution; may be re-deployed rather than sold, but not guaranteed |
| Liquidity unlock | Market makers, LP providers | Can reduce protocol-controlled liquidity; indirect price impact via spread widening |
To translate an unlock calendar into actionable intelligence:
- Calculate net new float — For each unlock date, identify the number of tokens becoming transferable. Express this as a percentage of current circulating supply. An unlock adding 5% of circulating supply in a single event is materially different from one adding 0.5%.
- Compare it to average daily trading volume — If the unlock releases tokens worth 3–5× the average daily trading volume (ADV), absorption risk is high. This ratio — unlock size relative to liquidity — is the primary explanatory mechanism behind observed price responses to unlock events.
- Compare to fully-diluted market capitalization — Calculate what percentage of FDV the unlock represents. A large FDV relative to circulating supply, combined with near-term heavy unlocks, is a structural dilution signal worth flagging.
- Layer unlock dates against project catalysts — Unlocks scheduled near known catalysts (exchange listings, product launches) may see different absorption dynamics than unlocks in quiet periods.
Airdrops

Airdrops distribute tokens to defined recipient sets, typically as a bootstrapping or reward mechanism. The structure of an airdrop has direct supply implications that are frequently underappreciated.
Retroactive airdrops distribute tokens to users who interacted with a protocol before a defined snapshot date, rewarding past behavior. The snapshot method (which actions qualify, what time window) and sybil resistance approach (whether the project filtered wallet farms) determine how concentrated or dispersed the distribution is.
Engagement / incentive airdrops distribute tokens to users who complete defined actions going forward (quests, liquidity provision, referrals). These may drip over time rather than land as a single event, and the recipient behavior (immediate sale vs. continued engagement) is harder to predict.
For any crypto airdrop, examine in depth:
- Snapshot method — What wallet state or action history was used? Published on-chain criteria are more verifiable than opaque eligibility lists.
- Sybil resistance — Did the project use clustering analysis, minimum balance thresholds, or other filters? Low sybil resistance means a larger portion of recipients are likely to sell immediately.
- Claim window — How long do recipients have to claim? A short window concentrates selling pressure; a long window extends it. Confirm the deadline.
- Unclaimed token treatment — Are unclaimed tokens burned (deflationary) or returned to the treasury (neutral to slightly bullish, as they remain non-circulating until deployed)?
- Liquidity status at claim — Are claimed tokens immediately liquid, or subject to a lock or vesting schedule? Immediately liquid airdrop tokens with high sybil exposure represent maximum near-term sell pressure.
Whether an airdrop increases circulating supply immediately or drips via vesting is a structural detail that directly affects the unlock schedule. An airdrop with immediate liquidity for all recipients is functionally a TGE unlock for that tranche; an airdrop subject to linear vesting functions like a periodic vesting unlock.
Staking Rewards
Staking rewards are another distribution mechanism that can be either inflationary or non-inflationary depending on the funding source. Staking rewards as emissions (inflationary) has new tokens minted and distributed to stakers on a schedule. Unsurprisingly, this increases total supply over time.
Rewards funded from fees or treasury are non-inflationary if sourced from protocol revenue (trading fees, liquidation fees, etc.) or from an existing treasury allocation. No new tokens are minted. The difference is clear: inflationary staking rewards apply constant dilution pressure to non-staking holders, while fee-funded rewards do not. However, for fledgling crypto projects, producing an APY attractive enough to recruit enough validators for strong consensus without resorting to providing staking rewards from emission is challenging at best, so both models coexist.
Many staking implementations include lock-up periods (tokens must be staked for a minimum duration) or unstaking delays (a cooldown period after requesting withdrawal before tokens become transferable). These mechanics reduce near-term sell pressure by making staked tokens temporarily illiquid — effectively a soft vesting layer on top of the circulating supply figure. When assessing actual liquid supply, subtract tokens locked in staking contracts with active unstaking delays.
Treasury

The treasury represents tokens held in reserve for future deployment. It is not static — treasury decisions are ongoing distribution events that affect circulating supply over time.
Credible treasury management requires on-chain verifiability. Check whether the treasury wallet is controlled by a multisig (e.g., Gnosis Safe with a defined signer threshold) or a DAO governance contract where spending proposals are publicly voted on. On the contrary, treasury controlled by a single private key is a custody and governance risk.
Common outflow categories include: ecosystem grants (developer incentives, protocol integrations), liquidity incentives (farming rewards, LP subsidies), and operational expenses (team salaries, infrastructure, legal). Grants may eventually hit circulating supply when recipients liquidate; liquidity incentives hit circulating supply on a defined schedule; operational expenses are typically sold to cover fiat costs. To sum up, each spending mandate has a different market outcome.
When the treasury deploys tokens — via a governance proposal approving a grant program, a liquidity mining campaign, or an OTC deal — it is functionally a future unlock event for those tokens. Active governance proposals on the project's governance forum or snapshot page are leading indicators of upcoming supply changes.
Token Utility and Use Cases
If you removed all emissions and promotional activity tomorrow, would the tokenomics still generate organic reasons to hold or spend the token? This is how you separate utility from incentives, which we will discuss immediately after.
Fees
Fee-based utility is one of the most measurable forms of token demand on a blockchain because it ties holding or spending to actual product activity: ETH is not losing out on value because of migration to Layer-2, it keeps it as the network securing them as well.
The gas token is the medium of payment for network computation; think no further than ETH gas fees. Any user submitting a transaction must acquire and spend the token to transact; some chains require a minimum balance in the native token at all times. If fees are burned (EIP-1559 style), each transaction permanently reduces circulating supply, creating a direct link between network activity and scarcity; if fees go to validators/stakers, demand is sustained through staking requirements.
The protocol or service token is charged by a specific application layer — swap fees on a DEX, origination fees in a lending protocol, marketplace listing or settlement fees. In most cases, users merely spend (sell or convert) the token at point of use rather than maintain a balance, which means demand is transactional rather than inventory-based. Demand persistence depends heavily on volume; a protocol with declining usage generates declining demand regardless of tokenomics design. Where fees are redistributed to token stakers, holders have an economic incentive to maintain a position, which somewhat extends demand persistence.
Holding or staking the token for fee discounts or rebates unlocks the benefits should you opt into the discount mechanism. Users must maintain a minimum balance to qualify, creating sticky inventory demand. If the fee savings are small relative to the token's price volatility, the rational trade may be to not hold and pay full fees instead.
Governance

Holding a token that represents voting rights in a high-value project can sound enticing but to be completely honest, governance utility is frequently overstated because "voting token" is often confused with "real control." Community governance power exists on a spectrum, and the practical demand mechanism — why someone would buy and hold a token specifically to govern — varies significantly across levels.
Signaling-Only Votes are off-chain polls (e.g., Snapshot) that measure community sentiment without binding on-chain execution. Nothing is automatically changeable; a multisig or foundation must choose to act. Ergo, no safeguards are enforced by code. The demand mechanism for tokens backing this model is rather weak. Holding a token for signaling governance only makes sense if you believe signal translates to foundation action, which is a social rather than economic guarantee.
On-chain votes that directly update protocol parameters (Fees, Collateral Factors, Emissions) through a governance contract present a more involved picture. The typical safeguards are quorum requirements (minimum participation threshold), approval thresholds (often supermajority), and timelocks (a mandatory delay — commonly 24–72 hours — between proposal passing and execution, allowing users to exit before changes take effect). The demand created by this model can be described as moderate to strong. Controlling parameters that determine protocol economics gives large holders a direct financial interest in governance outcomes, which creates token demand from protocol stakeholders, competitors, and adversarial actors alike.
Votes that authorize spending from a protocol treasury or upgrading core smart contracts with longer timelocks, higher quorum, and sometimes a guardian veto secure the strongest demand, at least in theory. Treasury control represents real capital allocation power. In practice, demand is concentrated among large holders, and smaller participants may find participation costs (gas, attention, delegation complexity) exceed their influence.
Governance utility can be weaker than it appears. Even where on-chain governance exists, several structural factors reduce its effective utility value. Delegated voting concentration — where a small number of delegates or protocol teams hold a disproportionate share of voting power — can mean that retail token holders have no realistic influence over outcomes, reducing governance from a meaningful use case to a nominal one.
Access
Access-based token utility creates demand by requiring or incentivizing token ownership as a prerequisite to using a product, feature, or opportunity. For example, users can pay tokens to access a product or service — an API call, a data feed subscription, a premium feature set. Access is typically non-transferable (consumed at point of payment). Note that if users can purchase the token spot, consume it immediately, and hold no inventory, demand is transactional and price-sensitive. The access utility is real but creates minimal holding demand unless the payment frequency is high enough to require maintaining a working balance.

A direct alternative is when users lock or stake a minimum token balance to maintain access — to a yield-generating vault, a protocol's institutional tier, a data oracle, a launch participation window, or other gated opportunities that require continuous eligibility. The model implies access is tied to the staking address and is not transferable without unstaking. An edge case that calls the model into question is if a third party offers a pooled staking vehicle (a tokenized staking receipt), individual users may access the benefit without direct token exposure, reducing individual holding demand.
Speaking of gated rights, in another model, holding above a threshold unlocks a feature tier — reduced fees, early access to product launches, whitelist participation, or governance weight multipliers. Rights are typically tied to wallet balance rather than a specific credential, so they are transferable by selling the tokens. Consider this, though: if tiers are set in token units rather than USD-equivalent value, a rising token price can inadvertently move users up tiers without additional commitment, diluting the exclusivity of higher tiers.
Access utility is distinct from NFT-based credentials and off-chain subscriptions, including in ways that matter for demand analysis. An NFT that grants access creates demand for the NFT, and an off-chain subscription (email, SaaS API key) that merely accepts token payment treats the token as a payment rail, not an access key; once spent, no holding demand is created.
A token functions as a true access key only when the protocol's smart contract logic checks token balance or stake status at the point of service delivery, and when no alternative credential can substitute. If a protocol accepts both token payment and credit card payment for the same feature, the token's access utility is optional, not structural.
Collateral
Collateral utility arises when a token is accepted in lending protocols, derivatives platforms, or stablecoin minting systems. The mechanics are consistent enough across most blockchain protocols that evaluators can apply a standard framework.
When a token is posted as collateral, the protocol assigns it a collateralization ratio (or loan-to-value, LTV) — for example, 70% LTV means a user can borrow up to $70 of stablecoins or other assets against $100 of token collateral. The protocol also sets a liquidation threshold — the price level at which the collateral position becomes undercollateralized and is automatically liquidated, typically at a slightly higher LTV than the borrowing cap (e.g., borrow at 70%, liquidate at 80%).
Volatility is the critical variable: a highly volatile token requires a lower LTV to absorb price swings without triggering liquidation, which means each dollar of token collateral generates less borrowing capacity. This relationship between volatility and effective borrowing power is why collateral utility is sensitive to market conditions and why demand from this use case can compress rapidly during stress events.
Incentive Design and Mechanisms
If utility is what the token is supposed to be used for, token-based incentive systems define what behavior a protocol needs to coordinate. Staking and validator rewards optimize for security — aligning participants with network integrity. Liquidity mining targets liquidity provision, purchasing depth and volume from external capital. User rewards address adoption and retention, shaping how real users engage with the ecosystem over time.
Staking
We are not going to describe how crypto staking works because that guide does. Instead, let’s unpack the design variables of staking rewards and their direct implication to evaluate risk and return.
Does the reward come from new supply or fees? If staking rewards are funded by inflation rate expansion rather than protocol fees, every staker's gain is every holder's dilution. Fee-funded rewards signal organic demand; inflation-funded rewards signal a subsidy.
For how long is the stake illiquid? Longer unbonding windows reduce exit liquidity and dampen "mercenary" behavior, but they also trap capital during market stress. Evaluate whether the unbonding period is proportionate to the network's maturity.
Is slashing a concern? Slashing introduces risk of loss beyond market price movement. Check whether slashing applies to liveness failures, double-signing, or both — and whether delegators share the penalty.
What is the minimum for participation? High minimum stakes concentrate staking reward access among large holders, reinforcing centralization. At the same time, low minimums with no delegation cap can fragment security.
Do rewards compound? For one, auto-restaked rewards increase emissions pressure if the reward source is inflationary. Auto-restaking accelerates token supply growth and can suppress price if sell pressure from compounded rewards exceeds demand.
Longer unbonding periods and reward structures that include fee revenue, making yield contingent on actual network usage, are not pretty but they disincentivise mercenary staking: participation without alignment with the protocol, meaning as soon as it stops being attractive for any reason, stakers quit. Graduated unbonding schedules or dynamic rewards that adjust to staked supply can help smooth out selling pressure from large unlock or unbonding events. Look for delegation caps, anti-concentration scoring in reward distribution, or quadratic reward curves if you are concerned about centralization.
Validator rewards directly set the security budget of the ecosystem. Higher rewards attract more validators and more stake, increasing cost-of-attack — but they do so at the expense of token holders through dilution. Skewed reward distribution (where MEV, for example, accrues disproportionately to a few large operators) can undermine decentralization even when total validator count is high.
Liquidity Mining
Technically, liquidity mining is a mechanism for purchasing specific market behaviors using token emissions. Rewards can flow to liquidity providers (LPs), traders (via fee rebates), or market makers. LP rewards primarily buy depth at certain price bands; trader rebates buy volume; market maker incentives buy tighter spreads.
Liquidity mining is fickle but a net positive when the token being emitted has a credible use case beyond farming; the protocol might need bootstrapped depth before organic fee revenue can sustain LPs. Rewards should be time-bounded and taper as organic volume grows, and incentivized liquidity is concentrated at economically relevant price bands, not spread thin across the full range.
This is quite a lot of conditions! Evidently, if no remission decay or organic fee revenue are in sight, all good liquidity mining will do is create a short-lived TVL spike.
User Rewards
User rewards are distinct from liquidity mining in a critical way: they target human behavior — activation, retention, and specific actions — rather than capital deployment. It’s still buying certain behavior, just from a different category.

Incentives tied to a user's first meaningful interaction — completing a first transaction, connecting a wallet, or reaching an initial activity threshold are typically a one-time grant or fee rebate, designed to reduce the friction cost of trying a new product. Retention rewards structured to reward continued engagement — streak bonuses, tiered benefit programs that unlock at usage milestones, or loyalty multipliers on fees — target users who have activated but not yet formed a habit. Incentives can also be tied to direct specific actions to build organic community participation by making desired behaviors economically attractive — governance participation bonuses, referral rewards, or usage-based rebates that increase with volume.
Unlike liquidity mining, where capital can exit atomically, user reward programs attempt to build in switching costs and engagement loops because user reward programs are inherently vulnerable to extraction. Airdrop farming, bots, and immediate exit are the most common failure modes that also affect legitimate users. The design goal should be to raise the cost of abuse above the value of the reward, while keeping the cost for genuine participants low enough that it doesn't defeat the purpose.
Risks, Red Flags, and Key Considerations
The ability to find structural weaknesses that can quietly erode value before most participants notice is nothing short of a superpower in crypto. So, this section gives you a practical, tokenomics-specific risk checklist you can apply before investing or participating in any token or project.
Common Red Flags
The list below is non-exhaustive and applies to tokenomics only; even complete presale vetting is out of scope. However, knowing these patterns will help to evaluate a coin or token’s value more objectively:
- Imminent cliff unlock with thin trading volume
A large tranche of tokens—often team, investor, or advisor allocations—is scheduled to release all at once after a lockup period ends. Cliff unlocks can flood circulating supply overnight, creating immediate sell pressure with no gradual absorption. This is one of the clearest structural risks in any token unlock schedule.
Where to verify: Vesting dashboards (e.g., Token Unlocks, Vesting.xyz), the project whitepaper, or on-chain vesting contract events via a block explorer. - FDV-to-liquidity mismatch
A token has a very high fully-diluted market capitalization relative to its on-chain liquidity depth or daily trading volume. High fully-diluted market capitalization priced at current levels assumes the entire future supply will be absorbed at today's price—an assumption rarely supported by real demand in illiquid markets.
Where to verify: Compare fully-diluted market capitalization to 24-hour volume on CoinMarketCap or Messari; check DEX pool depth directly on the relevant AMM. - Concentrated circulating supply in top wallets
Only a small number of wallets (top 10–20, excluding known exchange wallets) hold a disproportionate share of tokens currently in circulation. High concentration creates whale risk—any single large holder can move markets, coordinate exits, or dominate governance votes.
Where to verify: Explorer token holders tab (e.g., Etherscan, Solscan); filter out labeled exchange wallets manually or via on-chain analytics tools.

- Unclear or unconstrained mint authority
If the token contract retains an admin key or mint role that allows new tokens to be created without a governance vote or public announcement, unconstrained minting can silently dilute circulating supply and market capitalization at any time, invalidating any supply schedule you've reviewed.
Where to verify: Smart-contract audit reports; review the contract's owner/admin functions on an explorer; check whether the mint role is burned or time-locked. - Missing or incomplete smart-contract audit
The token contract or associated protocol has not been audited by a recognized third party, or audit findings remain unresolved. Unaudited contracts introduce exploit risk that can drain liquidity pools or treasury reserves, affecting token price independently of any tokenomics design.
Where to verify: Project docs security section; audit firm websites (Certik, Trail of Bits, OpenZeppelin); GitHub repository. - Excessive insider allocation with short vesting
Team and investor wallets collectively hold more than 30–40% of total supply, with vesting periods shorter than two to three years is particularly relevant to newer projects. Insiders with large, quickly unlocking allocations have a structural incentive to sell into early retail demand, creating predictable downside pressure. If a project went through something like it and survived, assume the community stepped in after the founders jumped ship.
Where to verify: Whitepaper token distribution table; vesting dashboard; on-chain wallet labeling. - Rewards-driven activity with no organic retention
Seeing on-chain activity metrics (transactions, TVL, active wallets) spike during high-emission periods and collapsing when incentives drop? If demand is purely incentive-driven, the token's utility and demand case is hollow—the activity is farming behavior, not genuine usage.
Where to verify: On-chain analytics (Dune Analytics, Messari); compare activity before, during, and after previous reward epochs. - Governance token with no real governance power
A token can be marketed as a governance asset but proposals are non-binding, quorum is never reached, or a multisig controlled by insiders can override votes.
Where to verify: Governance forum participation rates; on-chain proposal history; smart-contract admin override functions. - Liquidity lock issue—unlockable or single-LP concentration
Liquidity is either not locked (and can be withdrawn by a single wallet) or is concentrated in one LP position that can exit without notice. A liquidity lock issue of this kind means the apparent market depth is unreliable; a single LP exit can cause catastrophic slippage for remaining holders.
Where to verify: DEX pool ownership on-chain; liquidity lock contracts (e.g., Unicrypt, Team Finance); LP wallet concentration via explorer. - No dump protection mechanism
If the token design includes no structural dump protection mechanism—no vesting enforcement, no sell tax, no staged unlock, no treasury buyback—to slow large coordinated exits, without any friction on large sells, insiders or whales can exit in a single session, with no recourse for remaining holders.
Where to verify: Whitepaper mechanics section; contract code for transfer restrictions or fee logic.

- Opaque team info
Is the founding and development team pseudonymous without a track record, or key team members cannot be verified against prior projects? Low team transparency combined with large insider allocations and short vesting is a compounding risk—accountability is absent at exactly the moment sell pressure would materialize.
Where to verify: LinkedIn, prior project on-chain histories, doxxing or KYC disclosures in project docs. - Market cap entry point vs. fully-diluted market capitalization discrepancy
Picture this: the market capitalization based on circulating supply looks attractive, but the fully-diluted market capitalization (total supply × current price) is multiples higher. Your market cap entry point may appear reasonable while the project is implicitly priced at a valuation only justifiable if full dilution is absorbed at current prices—rarely realistic.
Where to verify: CoinMarketCap or Messari token page; cross-reference circulating supply against total and max supply figures.
Token Unlock and Dilution Risk
Understanding the mechanics of vesting before you assess a token is essential due diligence. Start with separating cliff vesting and linear vesting. If tokens are locked for a fixed period, then released all at once, it’s cliff vesting. Tokens unlock continuously over time, typically daily or monthly? You are looking at linear vesting. This creates a smoother, more predictable supply increase.
Research and market data indicate that large unlock events have historically tended to precede negative price pressure, particularly when insider allocations become liquid. This is a historical tendency, not a guarantee; outcomes vary based on market conditions, token utility, and demand at the time of unlock.
Centralization and Insider Allocation Risk
Don’t assume everything in crypto is decentralized by default. Centralization in tokenomics compounds into governance risk, supply control risk, and long-term structural fragility, not to mention the price risk.
If the top 10 non-exchange wallets hold more than 30–40% of circulating supply, concentration risk is significant.
Review the whitepaper's token distribution table against on-chain wallet data:
- Are team and investor allocations consistent with what's disclosed? On-chain, you can often verify this by checking whether labeled team/investor wallets match the vesting contract beneficiaries.
- What percentage of total supply do insiders collectively control? Allocations above 40–50% combined are a meaningful flag for insider allocation risk.
- What is the vesting timeline relative to the project's expected growth phase? Short vesting in early-stage projects front-loads sell pressure into the same window as initial retail participation.
Here's another risk that's frequently overlooked: when team and investor wallets hold both large token positions and governance voting power, the same unlock event that creates sell pressure also shifts governance influence. Insiders can vote on protocol changes (fee structures, emission rates, treasury deployments) that benefit their exit timing — then sell. This dual exposure makes insider allocation risk more severe than pure price impact suggests.
Utility and Demand Risk
A token can have a structurally sound supply schedule and still fail if demand for the token itself is artificial or unsustainable.
If it is a payment or fee token, are fees denominated in and burned/spent in the protocol's native token, or can users pay in any asset (e.g., stablecoins, ETH)? If the payment in the native token is optional or avoidable, transactional utility is weaker than it appears.
If it is a governance token, what is the average participation rate? Are proposals binding on-chain or advisory? A governance token where fewer than 5% of circulating supply participates in votes, or where a multisig can override results, has limited real governance utility.
A token with speculative utility is held primarily because holders expect its price to increase. This is the weakest form of utility because it is entirely reflexive — demand depends on the belief that more demand will follow.
One of the most common structural failure modes in tokenomics is circular utility: the protocol emits tokens as rewards to bootstrap activity (liquidity, transactions, users), but demand for the token is itself driven by those same rewards. When emissions drop or end, farmers exit because the yield is gone, TVL and transaction volume fall sharply, token price falls because the primary demand driver (yield farming) has disappeared, and lower token price reduces the value of remaining rewards, accelerating the exit.
Liquidity and Market-Structure Risk
Even well-designed tokenomics can be invalidated by the market structure surrounding the token. Liquidity is not a background condition — it is a primary variable in how supply and demand mechanics actually function.
Key Liquidity Risk Vectors:
- Shallow order books: On centralized exchanges, a thin order book means even modest sell orders move price significantly. This amplifies the impact of any unlock event or whale exit.
- High slippage on DEXs: On decentralized exchanges, small pool depth relative to trade size creates high slippage, discouraging large legitimate trades and making the token's "market price" unreliable.
- Fragmented liquidity across venues: If a token's liquidity is split across five DEXs, two CEXs, and multiple chains, no single venue has sufficient depth. Aggregated volume statistics can look healthy while individual venue depth is dangerously thin.
- Liquidity lock issue—locked vs. unlockable: LP tokens that are not locked—or locked with a short duration—can be withdrawn at any time. This is a liquidity lock issue that can manifest suddenly, creating a near-instant liquidity crisis.
- LP concentration (single LP wallet risk): If one wallet provides 60–80% of a DEX pool's liquidity, that wallet's exit removes most of the available market depth in a single transaction. This is one of the most underappreciated structural risks in smaller-cap tokens.
Tokenomics Data Sources and Tools
Knowing where tokenomics numbers come from is just as important as knowing what they mean. Different tool classes answer different questions, and no single source covers everything. You have checkers for quick orientation, explorers for on-chain ground truth, disclosure documents for stated intent, and vesting dashboards for unlock risk, so use them all.
Tokenomics Checkers
Aggregators like CoinMarketCap and Messari are the fastest entry point into any token's supply profile. It is home of quick snapshot metrics — circulating supply, total supply, max supply, fully-diluted market capitalization (FDV), allocation charts, and known unlock calendars pulled from project disclosures.
However, look elsewhere for real-time contract mint/burn permissions, undisclosed wallets or over-the-counter agreements, or any allocation change that hasn't been manually updated in the aggregator's database.
When using these resources:
- Confirm chain and contract address. Paste the contract address from the checker into the relevant block explorer and verify it matches the project's official documentation.
- Check the last-updated timestamp. Supply figures can be stale by days or weeks; a large gap between the timestamp and today is a red flag.
- Reconcile circulating supply against explorer contract data. Pull totalSupply and any known locked/burned amounts directly from the contract to see whether the checker's figure holds up.
- Confirm whether FDV uses max supply or total supply. Some projects have no hard cap; if the checker is using total supply as the denominator, the FDV figure is not comparable to projects with a fixed max.
- Cross-reference allocation percentages against the whitepaper. If the checker's allocation chart differs from the project's own whitepaper, treat both as unverified until you resolve the discrepancy.
Explorers
Block explorers give you the contract state as it actually exists on-chain — the only source that cannot be edited after the fact. The following step-by-step flow starts from a token contract address and ends with a defensible statement about supply and distribution.
- Locate the token contract. Start from the project's official website, whitepaper, or a pinned announcement. Copy the contract address from there — not from a third-party listing — to avoid interacting with a copycat token.
- Confirm it is the canonical contract. Check that the contract is verified (source code published), has the expected token name and symbol, and that the project has explicitly cited this address in its documentation. Look for any proxy or upgrade patterns that might point to an implementation contract behind the scenes.
- Read token decimals and totalSupply. On the explorer's "Read Contract" tab, call decimals() and totalSupply(). Adjust the raw integer by the decimal count to get the human-readable supply figure, and compare it against what aggregators report.
- Identify mint and burn functions. Switch to the "Write Contract" tab and scan for functions like mint(), burn(), burnFrom(), or pause(). Their mere presence is not a risk by itself — the risk is who can call them.
- Map privileged roles. Look for owner, admin, minter, or role-based access control variables. Call the relevant read functions (e.g., owner(), getRoleMember()) to identify which addresses hold those roles. Check whether those addresses are multisigs, timelocks, or single EOAs.
- Check top holder concentration. Open the token's holder list and review the top 10–20 addresses. Note what share of supply they control. Many explorers attach labels (Team, Treasury, Vesting Contract, LP Pool); for unlabeled large wallets, cross-reference with the project's stated allocation to determine whether they are explained or anomalous.
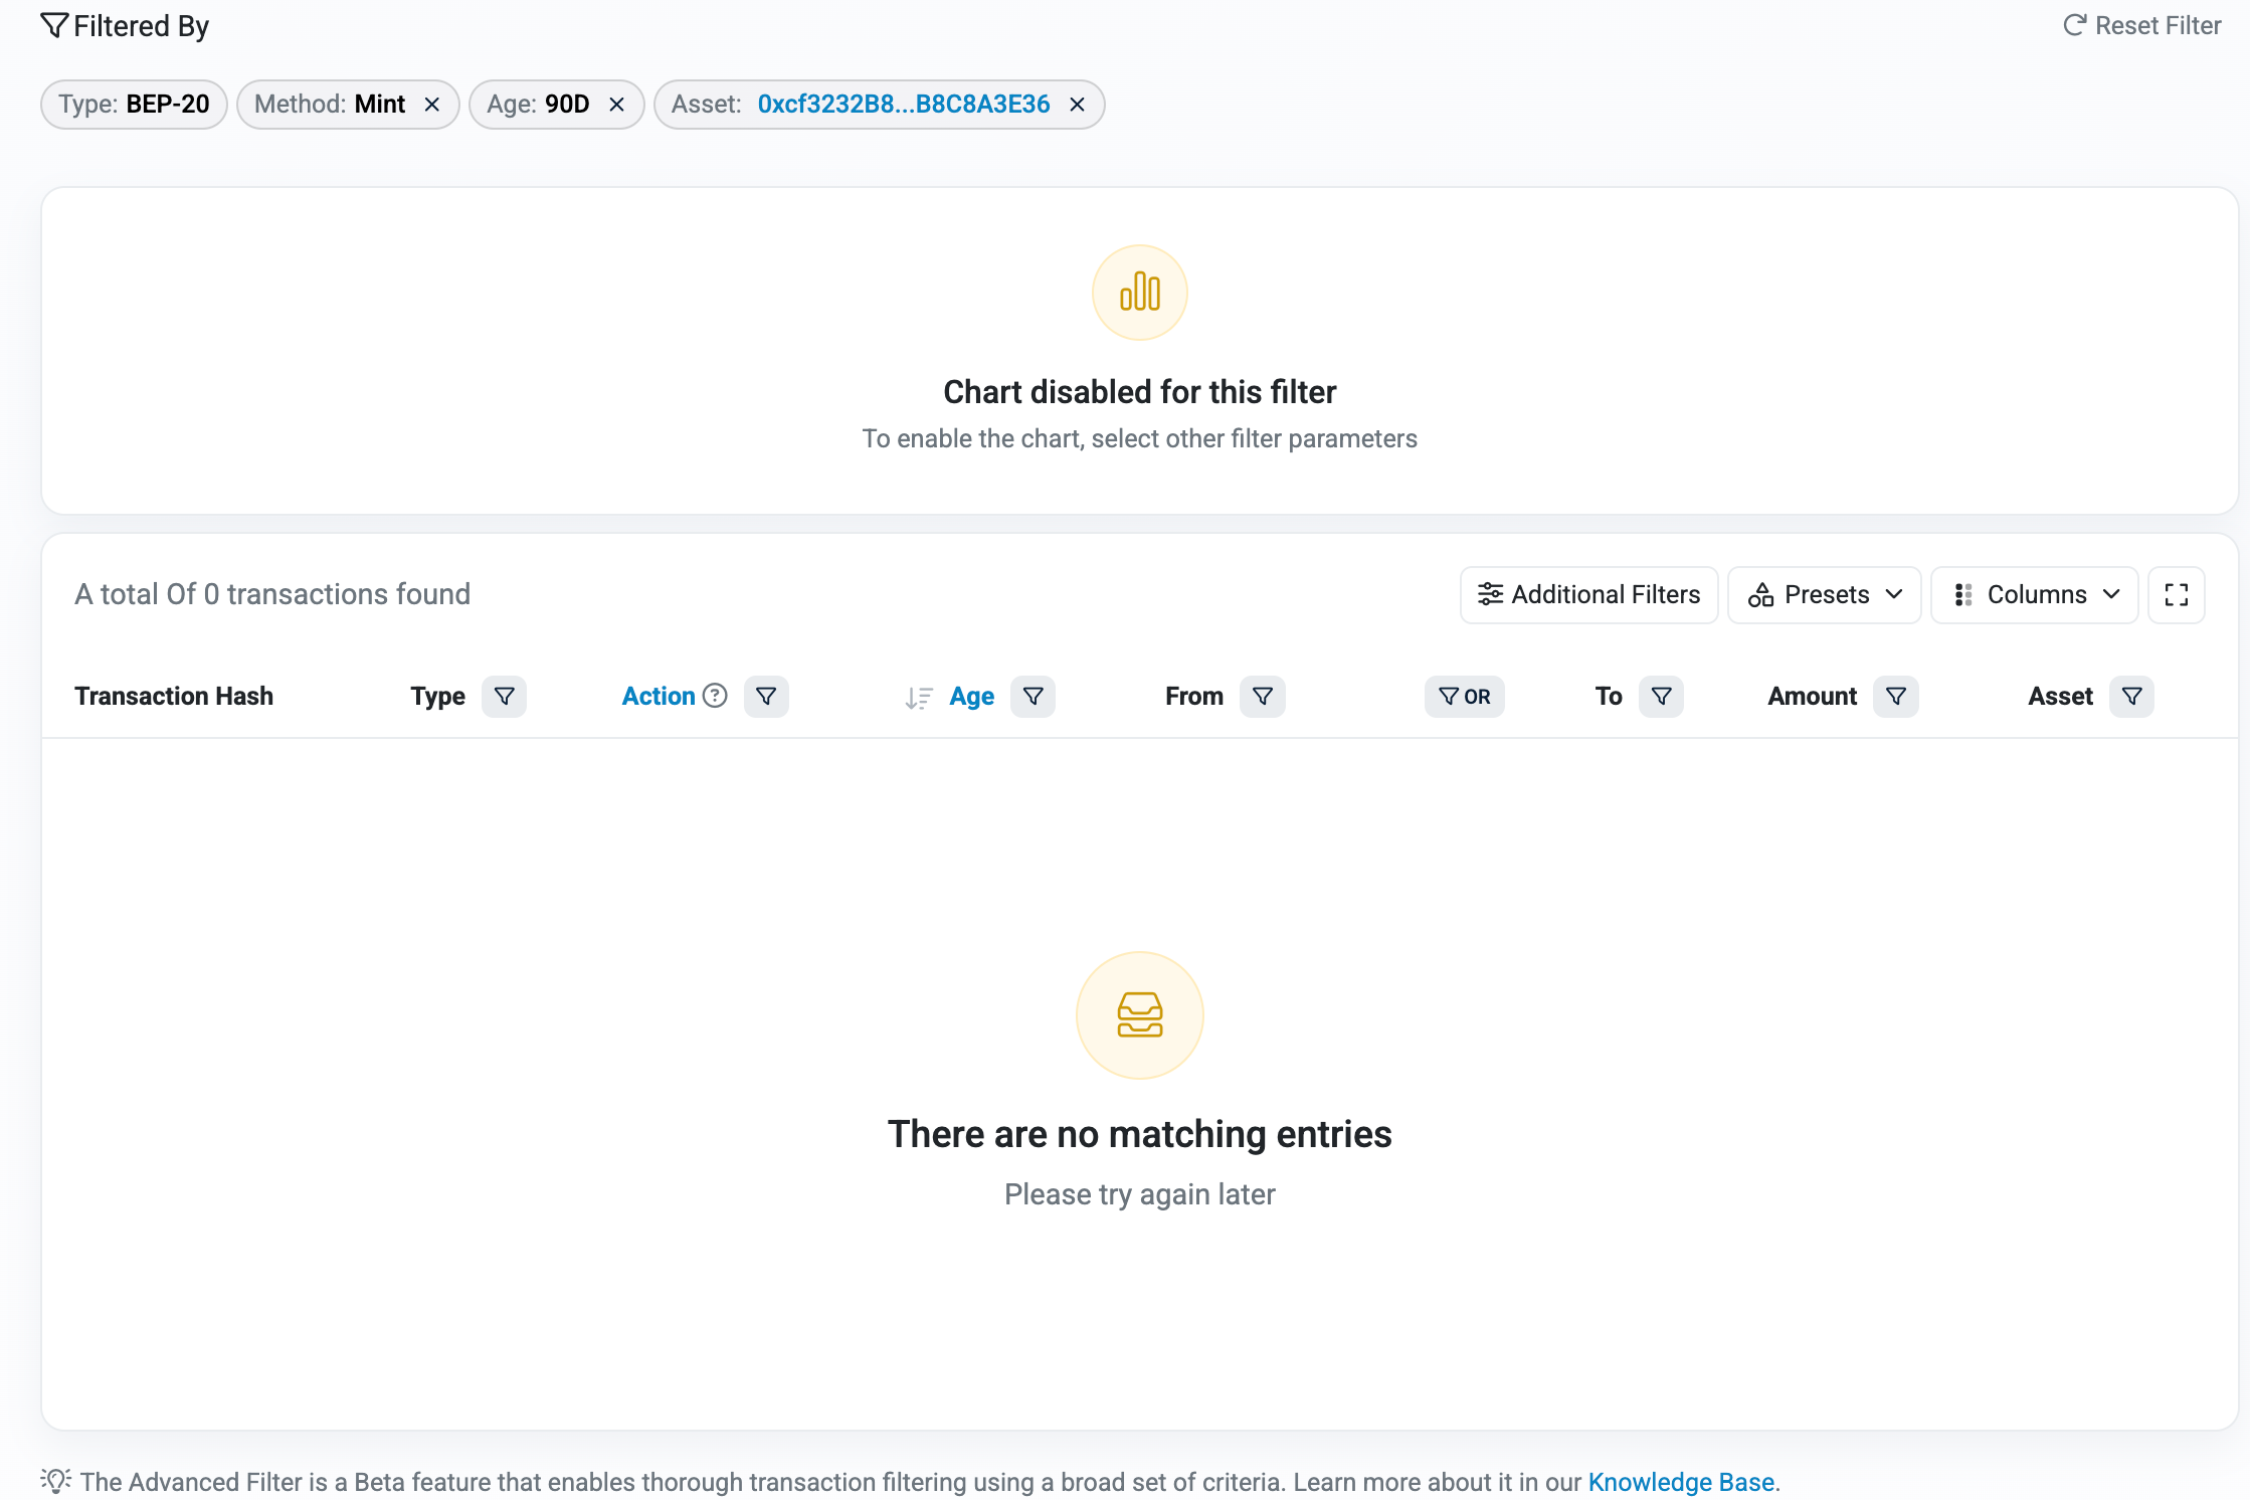
- Verify recent Transfer, Mint, and Burn events. Filter the contract's event log for the past 30–90 days. Large unexpected mint events or sudden burns warrant an explanation from the project. Patterns that do not match the stated vesting or emissions schedule are a due diligence flag.
- Check for upgradeability and admin key risk. If the contract is a proxy, find the implementation address and the upgrade function's access control. An upgradeable contract with a single-key admin can have its tokenomics changed unilaterally.
- State your conclusion. After completing steps 1–8, you can make a defensible on-chain statement: the verified total supply, whether uncapped inflation is possible and who controls it, the degree of holder concentration, and whether recent on-chain activity matches project disclosures.
Disclosure Documents
Project documentation exists on a spectrum from marketing copy to legally or technically binding commitments. Some are more reliable than others but the full picture can be assembled using multiple sources. Work through this hierarchy in descending order of trust and precision, extracting the specific data point noted for each level.
| Priority | Document | What to extract |
|---|---|---|
| 1 | Whitepaper / litepaper — token section | Total supply, allocation percentages, vesting schedules, emission curves, stated use of treasury. |
| 2 | Tokenomics / vesting blog post | Updated figures if the whitepaper predates a redesign; specific cliff and linear unlock dates. |
| 3 | Investor deck | Investor allocation size and vesting terms as disclosed to early backers; compare against public figures. |
| 4 | Smart-contract audit report | Scope pages confirm which contracts were reviewed; findings flag mint/burn permission risks and upgradeability; check whether the audit covers the deployed contract version. |
| 5 | Foundation / company financial or transparency reports | Treasury wallet balances, spending rates, reserve policies, and team token usage — where published. |
When what you read in a disclosure conflicts with what you see on-chain, prioritize on-chain data for supply and emissions. Treat off-chain statements as stated intent, not proof. Flag every discrepancy as a risk item. Check for contract upgradeability notes in the audit. If the deployed contract address differs from the one reviewed in the audit, the audit's conclusions may not apply to the live contract.
Vesting Dashboards
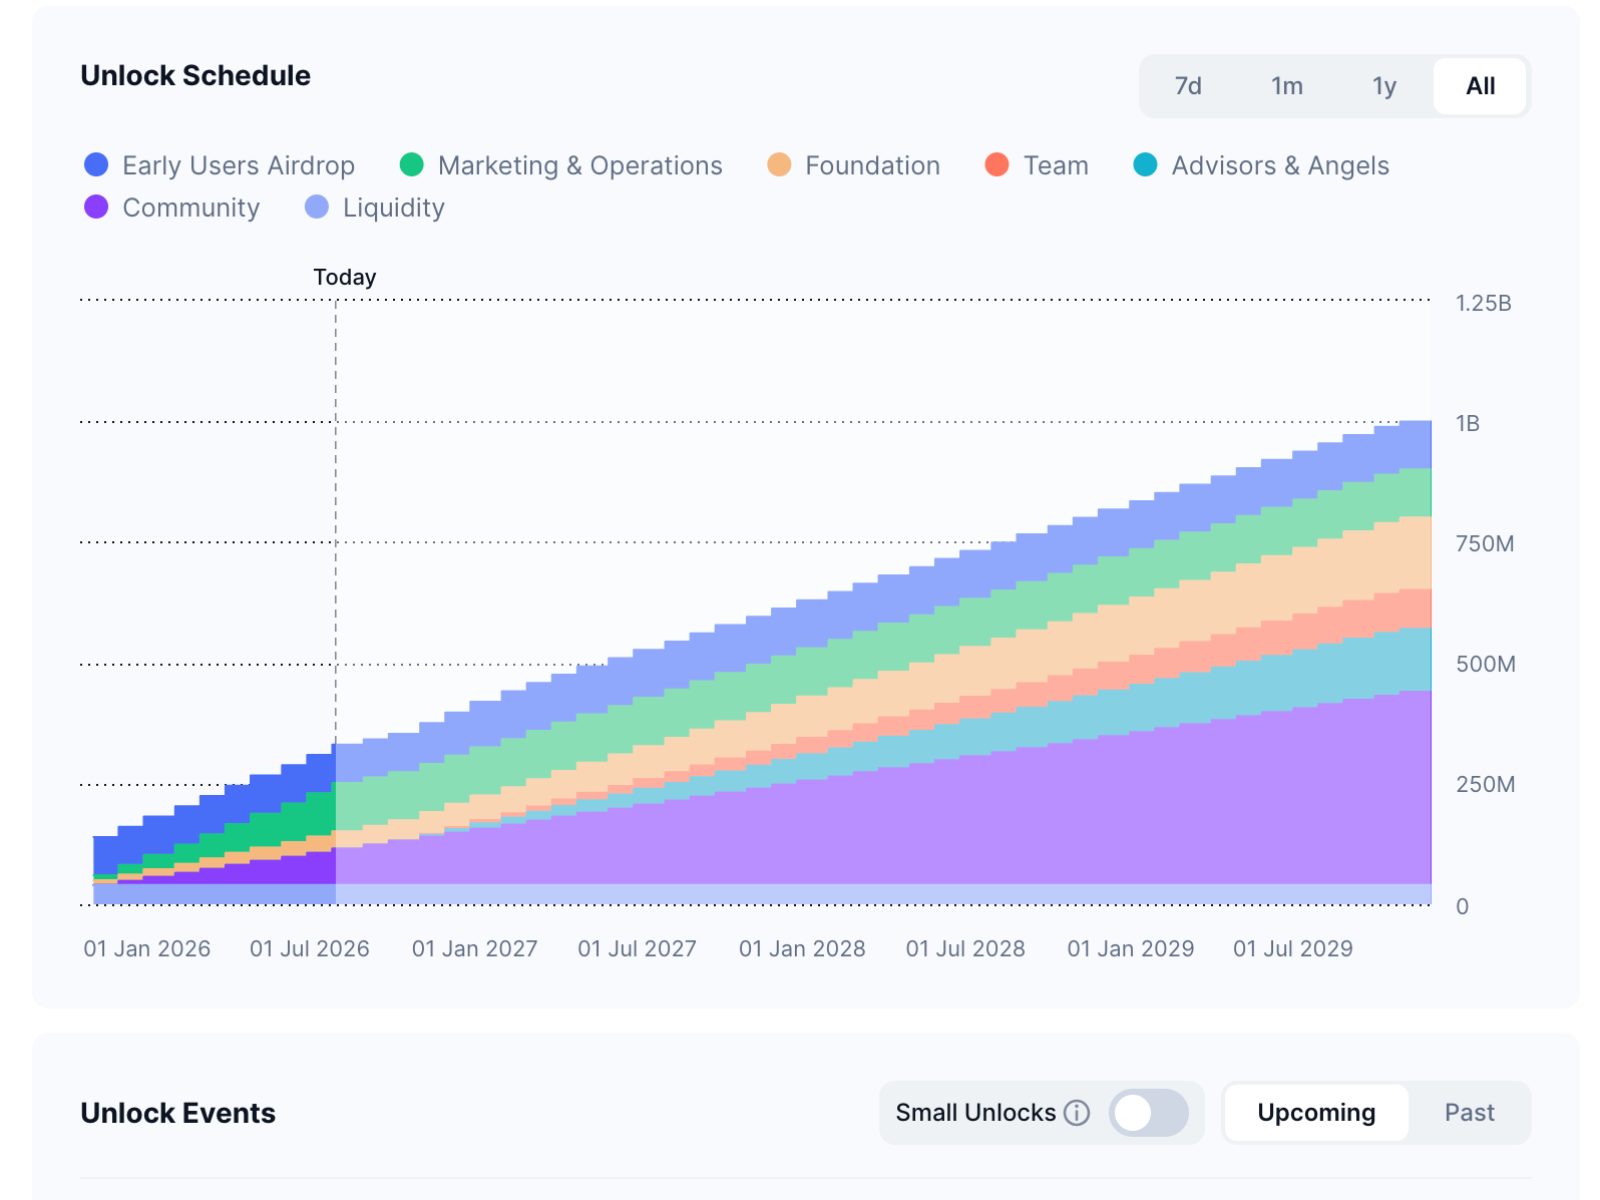
Before using an unlock calendar, confirm what you analyze: vesting, unlocks or distribution. A vesting schedule defines the contractual or programmatic timeline by which a recipient earns the right to tokens — it says when tokens are owed, not when they move or are sold. Entitlement and transferability do not always happen simultaneously. Distribution is the act of transferring unlocked tokens to recipients or into the open market; this is the step that creates sell pressure. Tokens can be unlocked for weeks before recipients choose to act, or sold within minutes of unlock.
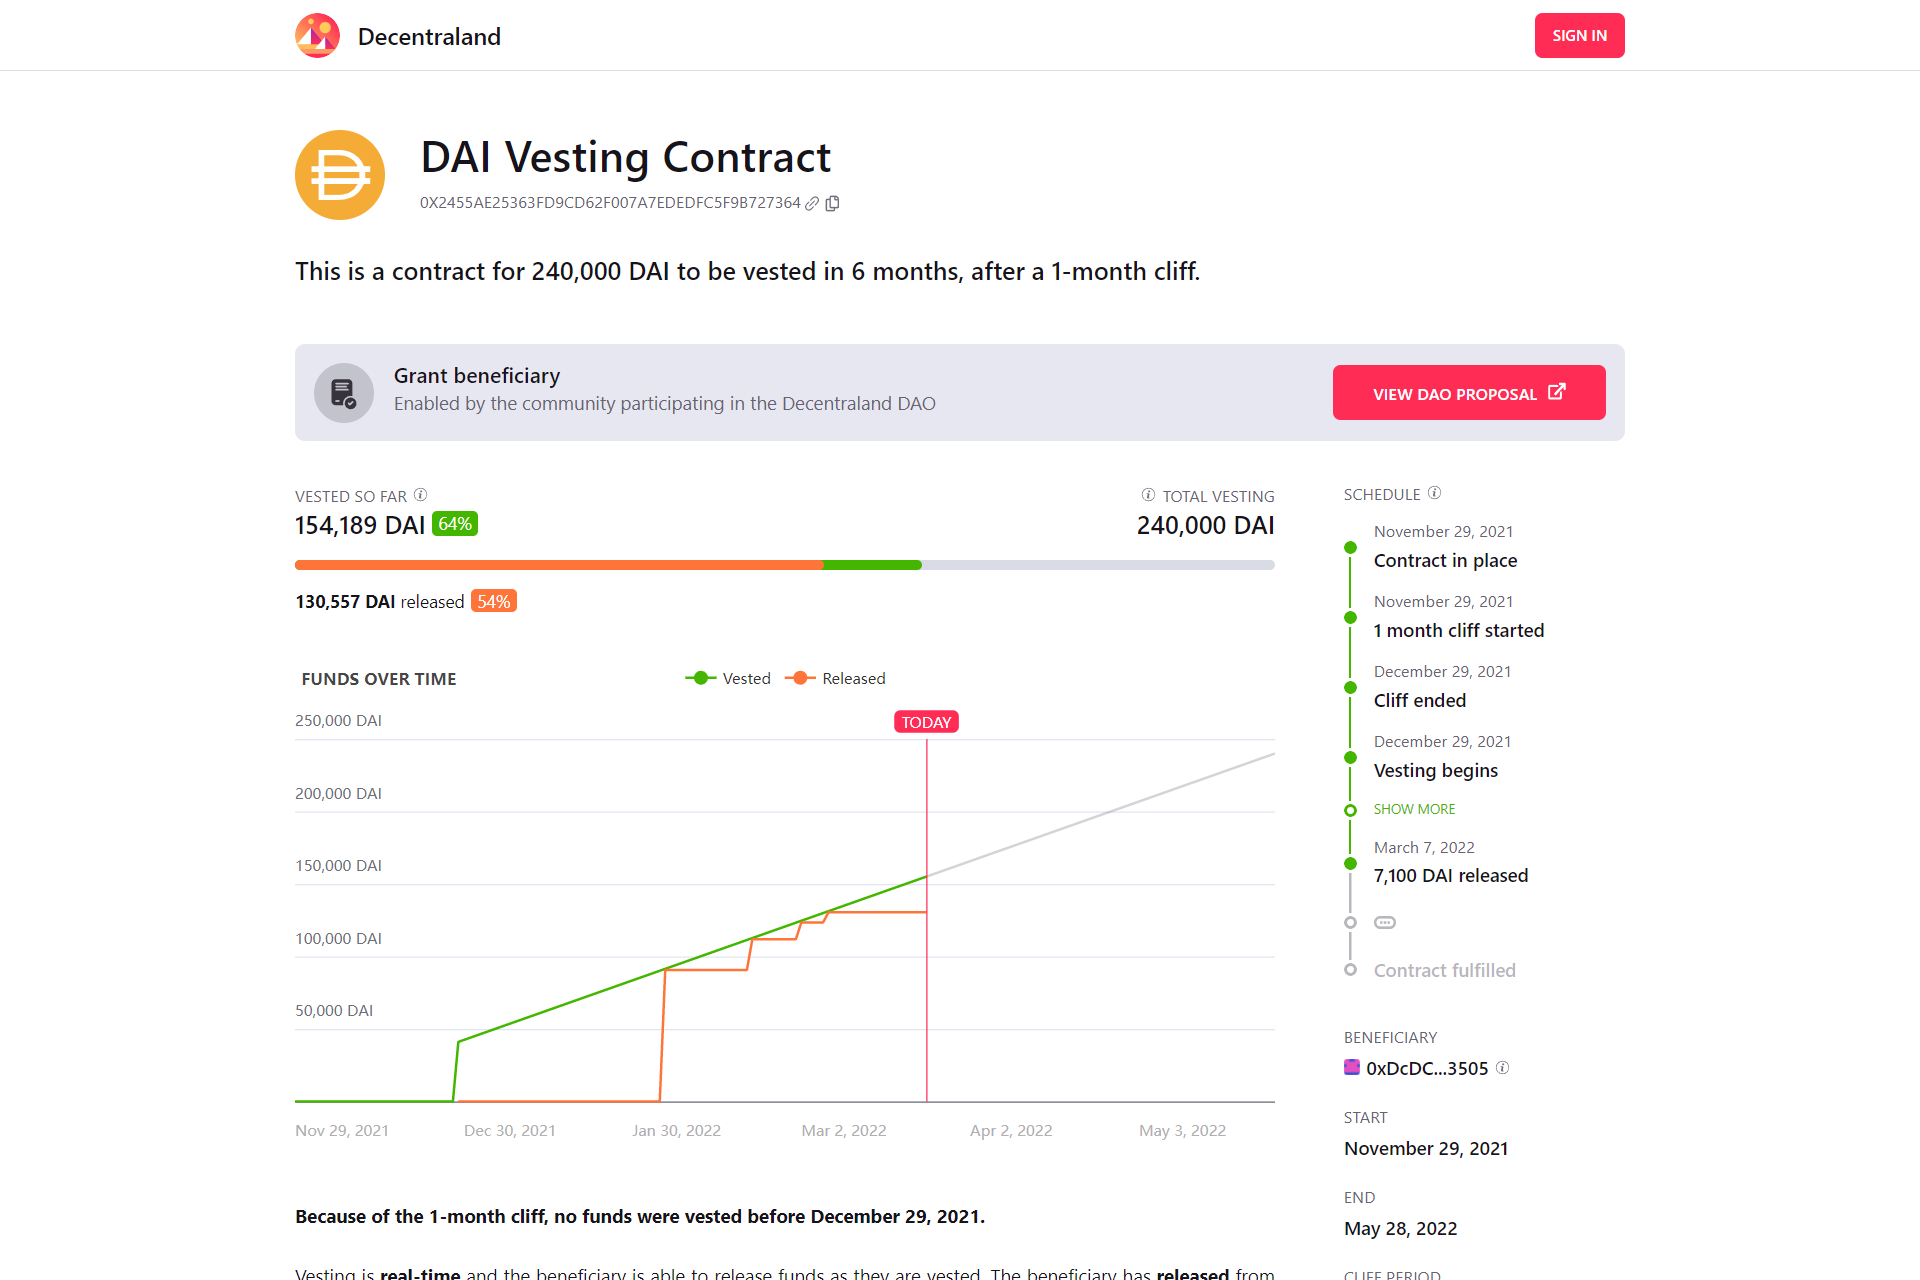
Once you clear that up, next items on your checklist should be:
- Cliff vs. linear schedule. Identify whether the unlock is a one-time cliff release (large lump sum on a single date) or a linear stream (small daily/monthly increments). Cliff unlocks carry concentrated market-impact risk.
- Allocation categories. Distinguish between team, seed/private investors, ecosystem/grants, and public sale unlocks — insider allocation categories typically carry higher selling pressure than ecosystem funds.
- Absolute amounts vs. percentage of supply. Verify whether the calendar displays raw token amounts or percentages. A "5% unlock" means very different things on a 100 M token supply versus a 10 B token supply; always convert to absolute terms and compare against current daily trading volume.
- Timezone and date precision. Some dashboards display dates without times or timezone anchors. A cliff unlock listed as "June 2025" with no further precision creates a two-to-four-week uncertainty window; on-chain timestamp verification eliminates this ambiguity.
- On-chain derived vs. manually maintained. Ask whether the dashboard pulls data programmatically from vesting contracts or is updated by a human editor. Manually maintained calendars can be outdated, incorrect, or incomplete — a smart-contract audit of the vesting contract itself is the strongest corroborating source.
- Whether vesting contracts are actually deployed. Some projects publish a token unlock schedule in a blog post with no corresponding on-chain vesting contract. If tokens sit in a team multisig with no programmatic lock, the "schedule" is a social commitment only.
- Historical accuracy. Check whether past unlock events on the calendar actually occurred on the dates listed. A dashboard with a track record of accurate past entries is more trustworthy than a newly published one.
Conclusion
Tokenomics is the economic rule set governing a project's supply, distribution, utility, and governance — not a price predictor, but the underlying logic that determines whether incentives can sustain a network over time. If you remember one thing from this guide, it should be this: headline market capitalization is not the asset; the rulebook is.
Frequently Asked Questions
What does tokenomics mean?
Tokenomics defines a project's economic rules governing its token. These rules determine how a token is created, distributed, and used — independently of short-term price movements or the project's underlying technology and roadmap. Understanding tokenomics means understanding the structural forces that shape long-term token value.
Why is tokenomics important?
Tokenomics matters because it produces measurable, predictable pressures on supply, ownership concentration, and governance that directly affect investment outcomes. Investors who ignore tokenomics are effectively ignoring the financial architecture of the asset they are buying.
Good tokenomics cannot fully offset poor product-market fit. A well-structured token attached to a product nobody uses will still lose value over time.
What is the difference between circulating supply and total supply?
Circulating supply is the number of tokens currently available and tradeable in the market; total supply is every token that exists today, including locked or reserved tokens. These two figures produce two different valuations, and confusing them is one of the most common errors in token analysis.
What is a token unlock?
A token unlock is the moment at which previously restricted tokens become transferable and can enter open-market circulation. It is distinct from vesting, which is the process of earning entitlement to tokens over time, and from emission, which refers to the creation of new tokens through protocol issuance.
How can I check a token's tokenomics before buying?
Checking a token's tokenomics before buying requires pulling data from multiple source types: official project documentation, on-chain explorers, vesting dashboards, and aggregator platforms.
- Read the whitepaper or official disclosure documents. Locate the supply allocation table, vesting schedule, and utility description. Record: total supply, max supply, and allocation percentages for team, investors, and public.
- Check market data on CoinMarketCap or Messari. Compare market capitalization to fully-diluted market capitalization. Record: the ratio of circulating supply to total supply, and the FDV/market cap multiple.
- Pull the token unlock schedule from a vesting dashboard (e.g., Token Unlocks, Vesting.finance, or Messari's unlock tracker). Record: the next 90-day unlock percentage of circulating supply and the recipient category (team, investor, ecosystem).
- Analyze on-chain concentration via a blockchain explorer (e.g., Etherscan for ERC-20 tokens). Review the top holder list. Record: the percentage of supply held by the top 10 wallets, excluding known exchange addresses.
- Assess the token's utility within the protocol. Confirm whether the token has a clear function (governance, fee payment, staking, access) or is primarily speculative. Record: at least one on-chain mechanism that creates token demand.
- Review the supply allocation and insider allocation terms. Confirm cliff dates, lockup durations, and whether team vesting aligns with project milestones. Record: team and investor unlock cliff date and percentage unlocking at cliff.
- Check inflation and emission rate. Identify whether the token has a fixed maximum supply or ongoing emissions. Record: current annual inflation rate as a percentage of circulating supply.
- Confirm smart-contract audit status, admin key controls, and minting permissions. Verify that the token contract has been audited by a reputable firm and that mint authority or upgrade keys are either renounced or held by a transparent multisig. Record: audit provider name, date, and whether minting permissions are open or restricted.