
FDV in Crypto: Beginner’s Guide to Fully Diluted Valuation


Key Takeaways
- 🧊 Fully diluted valuation (FDV) is the theoretical value of a crypto asset if its entire maximum supply were already circulating at today’s price;
- 🧊 FDV is not the same as circulating market cap. Market cap uses circulating supply, while FDV uses maximum supply or, in some cases, total supply as a proxy;
- 🧊 A large FDV-to-market-cap gap usually points to future dilution risk, especially when the token has a low float and large vesting schedules or unlocks ahead;
- 🧊 FDV is most useful when paired with circulating supply, token unlock analysis, liquidity, emission schedule details, and category-specific context;
- 🧊 Crucially, FDV does not predict price. It helps investors ask better questions about supply distribution, future float expansion, and whether a token’s current valuation is supported by real usage on the underlying blockchain network.
Disclaimer
FDV is a research metric, not investment advice. Token supply figures can vary by source depending on timestamp, indexing methodology, token migrations, and whether a platform uses maximum supply or total supply in its calculation. Always cross-check tokenomics documentation, blockchain explorers, and reputable data aggregators before making decisions. A high FDV, low FDV, or large FDV-to-market-cap gap does not guarantee any particular price outcome.
Fully diluted valuation (FDV) is a hypothetical measure of a cryptocurrency’s total worth, calculated as if its entire eventual token supply were already in circulation and valued at today’s price. Because it is a theoretical projection rather than a reflection of current market reality, FDV becomes most useful when interpreted alongside supply mechanics. FDV is not a price forecast, not a guarantee of future market capitalization, and not a standalone verdict on whether a token is overvalued or undervalued.
In conversations around emerging projects and their tokenomics, one metric occasionally turns up: fully diluted value, abbreviated as FDV. It is market cap adjacent, but this relationship makes it deceptively simple. At the same time, it is not too complex, either. In this guide, let’s take a look at what FDV is, how to evaluate it, who it is for, and what it actually means.
What is Fully Diluted Valuation?

FDV Meaning
By definition, fully diluted valuation is the theoretical value of a crypto asset if every token that will ever exist under its maximum supply were already circulating and priced at the current market rate. That assumption explicitly includes tokens that are not yet liquid: coins still locked in vesting contracts, allocations reserved for the team or investors, and units that have not even been minted yet.
“Valuation” in the term means the same thing as “market capitalization,” an estimated total value of all assets rather than a single unit. “Diluted” refers to supply dynamics, where “dilution” is more or less the same as “supply inflation” but from the point of view of current value. Hence, “fully diluted” means “as if it was fully in circulation.”
The point of FDV is that it is not some ceiling on value but rather, a snapshot. It tells you what the fully-diluted market capitalization could look like once all dilution has played out and all tokens circulate freely.
A quick example should make this easier to see. Say a token trades at $2 with 50 million coins actually in circulation. That gives it a $100 million market footprint right now. But if its maximum supply is capped at 1 billion tokens, the same $2 price implies a $2 billion FDV. Most of that figure represents tokens that do not exist in tradable form yet.
That gap between “what is trading now” and “what could exist later” is exactly what FDV is built to expose. It’s one component of what tokenomics is, and quite important in particular cases such as for investors buying crypto early.
Maximum Supply, Total Supply, and Circulating Supply
Supply terminology is where confusion between FDV and market cap begins. The three figures sound similar but answer different questions.
- Maximum supply is the hard cap — the absolute ceiling on how many tokens a protocol’s rules allow to ever be created. It is a future-facing number. Some of those tokens may not be minted for years, if ever, but it is the figure that FDV calculations rely on because it represents the fully diluted end state.
- Total supply tells you what has actually been minted or created up to this point, minus any coins that have been provably burned (in most methodologies). This number already exists on-chain or within the protocol’s ledger, but it does not mean all of it is available to trade. Some portion may still be locked, reserved, or held by the project team.
- Circulating supply is the narrowest and most immediately relevant figure: the count of tokens that are actually liquid and tradable in the open market right now. This is the number that feeds into standard market capitalization, and it is typically the smallest of the three because it excludes anything locked, vested, or not yet released.
What further complicates things is not every project publishes a clean, hard-coded maximum supply, and some can alter it through governance votes or protocol upgrades. When that happens, FDV may be unavailable outright, or it may vary significantly depending on whether a data provider uses “max supply” or substitutes “total supply” in its place.
FDV Calculation

FDV Formula
The core computation is straightforward: FDV = current token price × maximum supply. This formula assumes that every token within the maximum supply is already circulating and priced at today’s market rate — it is only a hypothetical valuation. A simple way to put it would be to compare it to market cap but with max supply instead of the current, but this simplification may cause some conflation between the two.
The current token price is pulled from an exchange or a live quote feed. This is usually expressed in USD per token, or your reference fiat currency, not in another crypto pair, to avoid conversion errors. Maximum supply, in turn, is sourced from the project’s tokenomics documentation or a data aggregator that tracks supply schedules and emission schedule details. This figure must be expressed in whole tokens, matching the same unit the price is quoted against. The output is a single USD-denominated figure representing total theoretical valuation.
If the maximum supply is expressed with decimals, rounding supply prematurely can shift the result by millions of dollars on tokens with large supply counts. In contrast, rounding the resulting FDV would be fine as this is an estimate, not a precise metric.
Example Calculation
Take a token trading at $0.85, with a maximum supply of 3 billion tokens.
- Step 1: Price = $0.85 per token
- Step 2: Maximum supply = 3,000,000,000 tokens
- Step 3: Multiply — $0.85 × 3,000,000,000 = $2,550,000,000
- FDV = $2,550,000,000, or approximately $2.55 billion
FDV on its own is not really informative. Next, compare this FDV to circulating market cap to gauge how much value is implied by not-yet-circulating tokens.
To see FDV’s sensitivity to price and supply inputs, consider the same token with only 400 million tokens circulating. Its current market cap would be $340 million — a fraction of the $2.55 billion FDV, illustrating how far apart the two metrics can drift.
Like market capitalization, FDV also moves linearly with price. If the price drops 30% to roughly $0.595 while maximum supply stays fixed at 3 billion, FDV falls by the same 30%, landing near $1.785 billion.
Supply Inputs and Missing Maximum Supply Cases
Not every project publishes a clean maximum supply or even has one, so the correct input depends on what data is actually available.
- A hard maximum supply exists: Use maximum supply directly in the formula. This is the standard, most defensible FDV calculation.
- Maximum supply is uncapped or unpublished, but total supply exists: In this case, “FDV” effectively becomes “fully diluted at current total supply.” It becomes an explicit proxy, not a true maximum, since the real ceiling is unknown and could grow over time.
- Neither maximum nor a reliable total supply is available: Avoid using FDV as a screening metric altogether. Instead, lean on circulating market cap combined with emissions and token unlock analysis.

One more practical wrinkle: data aggregators do not always compute “FDV” the same way. Some platforms default to maximum supply, others quietly substitute total supply when maximum supply is missing, and the labeling is not always obvious. Before comparing FDV figures across different sites, check which supply field each platform is actually using. Otherwise, you may be comparing two structurally different numbers under the same name.
FDV vs. Market Cap
Market Cap Formula
Circulating market cap follows a simple equation: circulating market cap = current token price × circulating supply.
The variable that needs the most care here is circulating supply, and it should be read operationally: it is the count of tokens that are freely tradable on the open market today. Not tokens sitting in vesting contracts, not team or investor allocations still under lockup, and not any non-transferable reserve. If a token cannot actually change hands right now, it does not belong in this number.
Before comparing market cap to FDV, apply one data consistency check: both figures need to be built from the same price timestamp and the same token unit. If a project has gone through a migration or redenomination, mixing a pre-migration supply count with a post-migration price will produce a gap that looks meaningful but is really just a snapshot mismatch.
FDV-to-Market-Cap Ratio
Once both figures are computed consistently, the relationship between them is captured by a single ratio: FDV ÷ circulating market cap.
Because both the numerator and denominator here share the same price variable, that price cancels out algebraically, leaving the ratio equal to maximum supply ÷ circulating supply. This simplification is useful because it isolates pure dilution potential from price volatility. In other words, it lets you compare how “diluted” two tokens are structurally, independent of what either one happens to be trading at this week.
We will have a closer look at this ratio later in the guide but for now, a short rundown is appropriate. In tokens where this ratio approaches 1, most of the supply is already circulating and there is little hidden dilution to investigate. A 2–5 ratio is moderate, and warrants a closer inspection of the token release schedule: how much and what on timeline is expected to enter the market. 10 times or more is a high ratio, which does not immediately discredit tokenomics but should tell you that your attention should be: who holds the non-circulating supply and under what conditions it is released.
Low Float and High FDV Tokens
“Low float” means a small circulating supply share at launch. The token has only begun releasing a fraction of what will eventually exist.
Two mechanics tend to drive the FDV/market-cap gap wider in these setups. First, large allocations — team, investors, treasury, ecosystem funds — remain locked and simply have not entered circulation yet. Second, thin liquidity in a low-float market means relatively small buy pressure can push prices up disproportionately. Since FDV multiplies that price against the entire maximum supply, the headline valuation can balloon even though very little of that value could actually be realized if holders tried to sell.

Research on token launches puts this in concrete terms: projects launching with roughly 2% to 5% circulating supply are common enough to be considered a standard low-float pattern, not an edge case. These projects can post a headline FDV that looks like it belongs in large-cap territory, while its actual market cap tells a much smaller story.
Once again, the right next move is not to dismiss the token automatically. It is to map out its float expansion timeline. When you spot a “high FDV, low market cap” setup, ground your investigation in:
- Current circulating supply as a percentage of maximum supply;
- Date of the next major unlock event;
- Who receives the unlocked tokens — team, investors, or treasury;
- Whether new supply enters via programmatic emissions, such as staking rewards, or discrete cliff unlocks;
- Whether current liquidity could absorb that new supply without a sharp price move.
Why FDV Matters
Token Dilution
FDV only tells half the story until you factor in how circulating supply moves toward maximum supply over time. That movement is what dilution actually measures.
Here is a numbers-first way to see it. Imagine a token with a $1 billion FDV, currently sitting at 10% of its maximum supply in circulation. A buyer today effectively owns exposure to a slice of that 10% float. Now hold the price completely flat and imagine that float expanding to 50% of maximum supply over the next two years as vesting contracts unlock and emissions continue.
The FDV headline has not changed at all. It is still $1 billion. But the buyer’s proportional exposure to the circulating pool has been diluted fivefold, and the scarcity profile they thought they were buying into no longer looks the same. Nothing about the price moved to cause this. The denominator did.
The question worth asking before buying into any FDV figure is simple: what percentage of maximum supply is already in the float, and how fast will that percentage rise?
It is also worth distinguishing two flavors of dilution. Some of it is scheduled — vesting cliffs, linear unlocks, and ongoing token emissions that follow a published timetable. Some of it is policy-driven, meaning governance votes or protocol upgrades can alter supply rules entirely, including cases where a maximum supply is not fixed at all.
Vesting Schedules
Token unlock schedules have distinct timing patterns, changing the FDV interpretation in each case:
- Cliff unlocks — a lump sum of tokens becomes transferable all at once on a specific date, often after an initial lockup period. These cliffs concentrate dilution risk into a single date, making that date a known pressure point rather than a gradual drift.
- Linear vesting — tokens release in small increments continuously or on a regular schedule, such as daily, weekly, or monthly, over a defined period. This model spreads dilution more evenly, softening any single-date shock but extending the window during which FDV keeps closing the gap with market cap.
- Protocol emissions — ongoing issuance not tied to a one-time allocation, such as staking rewards or block rewards that mint new tokens. Emissions create continuous supply drift, meaning the inflation rate itself — not just a single unlock event — is part of what determines how quickly circulating supply chases maximum supply.
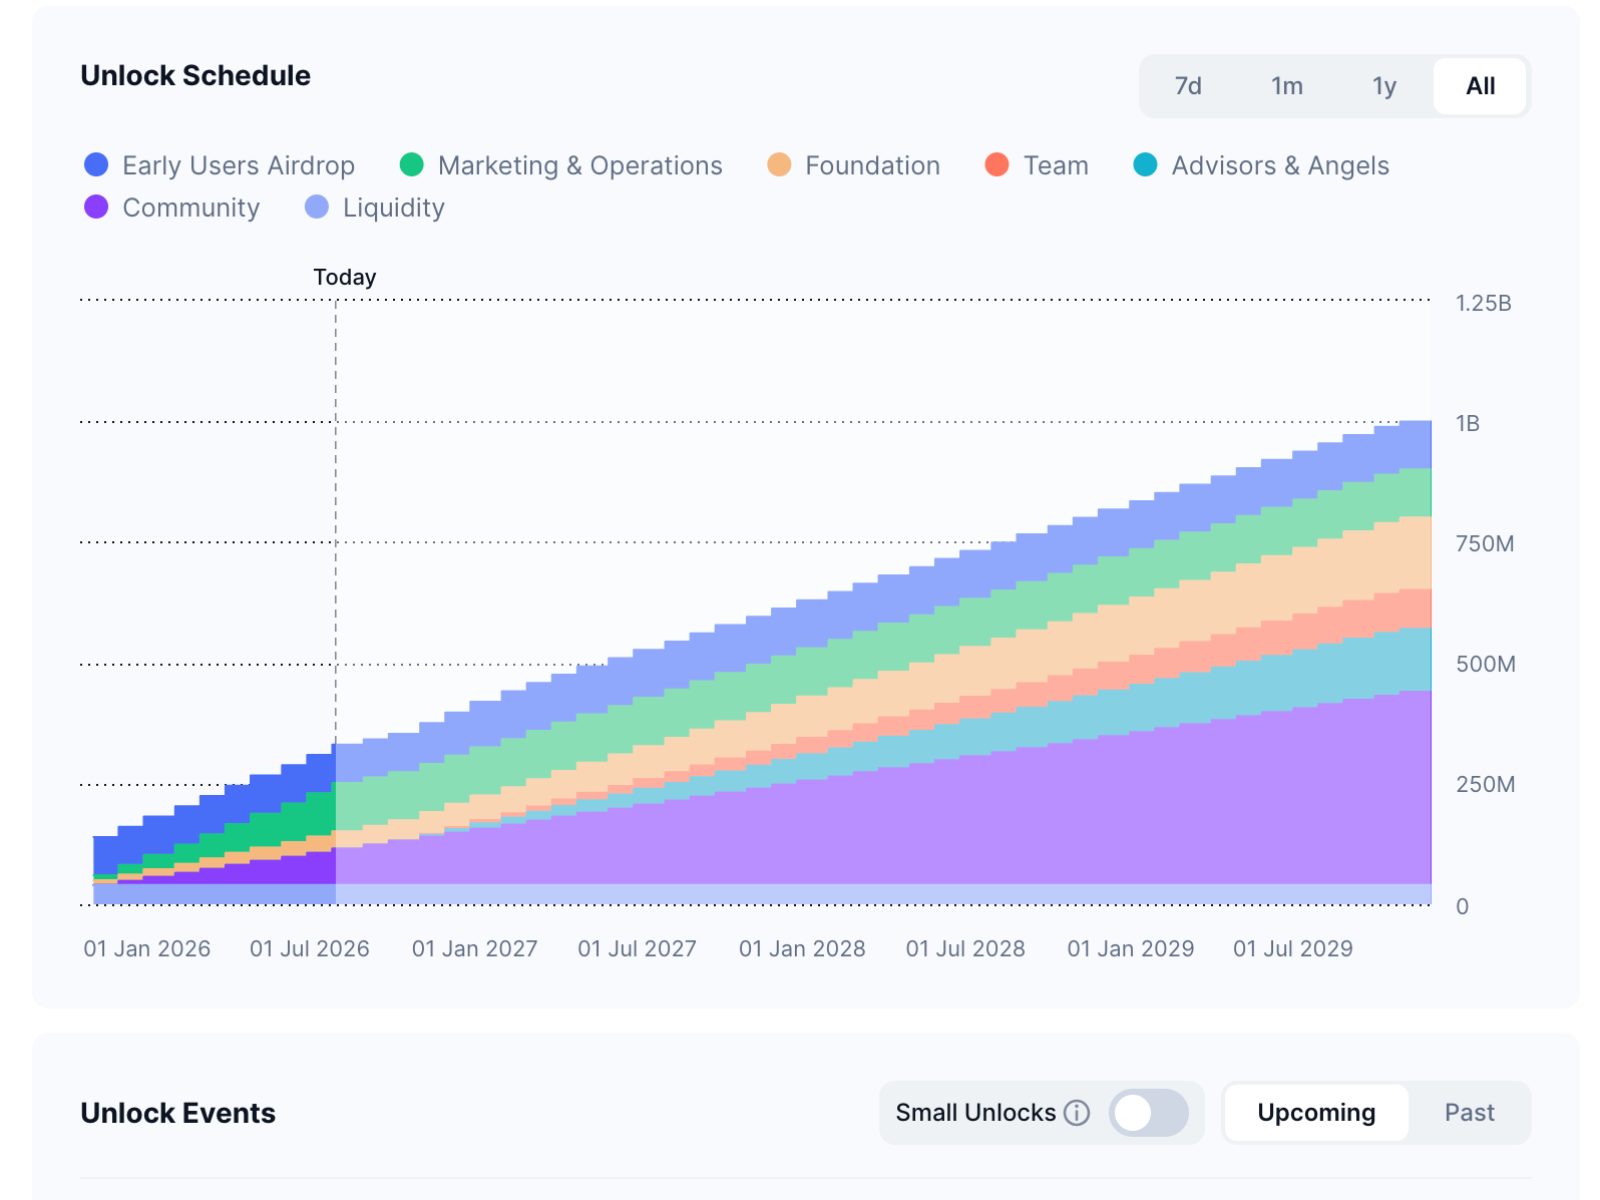
From there, what you should gather from the chart is a percentage of supply unlocking per month or quarter going forward and if applicable, the next two to three largest unlock dates on the calendar. Whether those will create any selling pressure also depends on who receives the unlocked tokens, if they become immediately liquid or not, and what is the mechanism (protocol-level hard-coded or discretionary and subject to policies).
Unlock Event Watchlists
An unlock event watchlist turns vesting information into a practical monitoring system. It is there for holders not to panic before every unlock but to know when supply conditions are about to change.
A useful watchlist should include:
- Unlock date — when the new tokens become transferable;
- Token amount — the raw number of tokens scheduled for release;
- Percentage of current circulating supply — the more useful dilution measure, because it shows how large the unlock is relative to today’s float;
- Recipient category — team, investors, treasury, ecosystem, staking rewards, or community allocation;
- Liquidity context — typical daily trading volume and order-book depth around the token;
- Follow-up behavior — whether unlocked tokens move to exchanges, staking contracts, liquidity pools, or remain idle.
If FDV shows the fully diluted ceiling, an unlock watchlist tells you how quickly the market is moving toward that ceiling.
Sell Pressure
Speaking of sell pressure, the mechanism connecting unlocks to price is a simple causal chain: an unlock increases the free float, a larger free float means more tokens are capable of being sold, and whether that capability turns into actual price impact depends on how much liquidity and trading volume exists to absorb it.
Defined operationally, sell pressure is not a vague sentiment. It is the net additional tokens likely to be sold into the market over a given time window, weighed against the order book’s ability to absorb that flow without a sharp price move.
All of this is to say that an unlock does not automatically translate into selling. Recipients may choose to stake their tokens, provide liquidity with them, or simply hold. Therefore, the more useful signal is incentive alignment.
Team and VC allocations, which are typically profit-motivated and time-bound, behave differently than community or staking-rewards recipients, who often have less urgency to sell. Pair that read on who is unlocking with a look at available liquidity to judge whether the market could absorb selling even if it happens.
Project Comparison
It would not hurt to repeat that on its own, FDV does not tell you much. Even comparing two projects on FDV alone — or even on the FDV-to-market-cap ratio alone — misses the dimension of time. A more decision-oriented framework asks:
- Circulating percentage of maximum supply today — how much of the theoretical ceiling is already tradable right now;
- Expected float expansion over the next 6–12 months — how much new supply is scheduled to enter regardless of today’s ratio;
- Concentration of upcoming unlocks — a single large cliff creates a known shock date, while distributed unlocks spread that risk over time;
- Liquidity context — typical daily trading volume or order-book depth, which determines whether the market could actually absorb the coming float without a disorderly price move.

Imagine Project A and Project B share the identical $500 million FDV. Project A is already 60% circulating, with the remaining supply trickling in through slow, ongoing emissions. Dilution risk is largely already realized. Project B is only 5% circulating, with several large cliff unlocks scheduled over the next year. Most of its dilution risk is still ahead of it.
Even large, well-established tokens are not immune to this gap. XRP, for instance, has at times shown a visible spread between its circulating market cap and its FDV — with circulating market cap sitting in the tens of billions of dollars while FDV registers noticeably higher due to tokens still working through vesting. The takeaway is not that a gap is disqualifying but any cross-project comparison should note both figures side by side, rather than ranking projects on FDV or market cap in isolation.
Good FDV Across Token Types and Release Schedules
Now, what does a good FDV even look like? A single FDV number does not mean the same thing across every corner of the market. The value drivers behind a Layer 1 blockchain, a DeFi protocol, and a meme coin are structurally different, and so are the dilution paths that determine how much of that FDV is likely to materialize as real market cap over time.
Treating FDV as a universal ranking metric without adjusting for token type is one of the most common ways investors misread it. The better question is not “is this FDV high?” but “is this FDV reasonable for this token type, this supply structure, and this release schedule?”
Layer 1 and Layer 2 Tokens
For base-layer and scaling tokens, FDV is tied to expectations about long-term network usage and security spend. Both are hard to verify directly but easy to sanity-check with a few pointed questions.
Before trusting an L1 or L2’s FDV as a signal of scale, run through this checklist:
- Is active user count or on-chain transaction activity trending up, flat, or down over the last few months?
- How much of the network’s security budget, such as validator rewards or sequencer incentives, comes from ongoing emissions rather than transaction fees?
- What share of total supply is still held by the foundation, core team, or ecosystem treasury versus already dispersed into public hands?
- Does the token allocation structure show a concentrated set of large holders who could influence both governance and future sell pressure?
- Is the current inflation rate from staking or block rewards disclosed clearly, or does it require digging through documentation to estimate?
One rule matters more than any single bullet point above: only compare L1/L2 FDVs across tokens sitting in similar circulating-percentage bands. A network that is 8% circulating and one that is 70% circulating are not playing the same game. Stacking their FDVs side by side will make the low-float network look artificially larger in scale than its actual tradable market suggests. Match maturity bands first, then compare.
DeFi and Governance Tokens

DeFi and governance tokens raise a different question: does the token actually capture value from the protocol it represents, or does it mostly let holders vote on parameters with no direct economic claim?
A compact three-part test helps separate the two before you take FDV at face value:
- Does the token capture fees or revenue, or is its role limited to governing protocol parameters with no cash-flow-like mechanism attached?
- Does inflation subsidize liquidity or usage, for example through emissions paid out as liquidity mining rewards, in a way that dilutes holders even while activity metrics look healthy?
- Is there a credible mechanism converting usage into token demand, such as staking requirements, buy-and-burn programs, or a real revenue-share structure, rather than governance rights alone?
Weak capture on all three fronts does not make a high FDV impossible to defend. It just makes it easier to justify only superficially, based on narrative rather than mechanics.
Watch for one specific failure mode here: a token can post high FDV and strong headline activity while its emission schedule for “incentive” programs is expanding supply faster than organic demand is growing. That combination can sustain a temporarily impressive-looking protocol while quietly diluting everyone holding through it.
The follow-up question is not whether incentives exist. Most protocols use them. The question is what the current emissions rate is and when those incentive programs are scheduled to taper. That detail tells you whether today’s activity is durable or emissions-funded.
Meme Coins and Community Tokens
Meme coins require the most caution of any category because FDV here often has almost no fundamental anchor. In practice, FDV for a meme coin is mostly a reflection of price multiplied by maximum supply. There is typically no protocol revenue, no staking yield, and no usage metric to tie the number back to.
Before treating a meme coin’s FDV as meaningful at all, verify the underlying supply design:
- Is the maximum supply fixed and hard-coded, or can new tokens still be minted under governance or team discretion?
- Are there active burn mechanisms reducing supply over time, or is supply strictly one-directional?
- Who holds the treasury or “community” allocation, and is that concentration publicly verifiable on-chain rather than just claimed in documentation?
Even after answering those, a caution is worth carrying forward: FDV comparisons across meme coins are largely meaningless unless supply is credibly fixed and the distribution is actually observable on-chain. Two meme coins with identical FDVs can represent completely different risk profiles if one has a verifiable fixed cap and transparent holder distribution while the other does not.
One release-dynamics rule specific to this category: when maximum supply is already circulating, or very close to it, FDV and market cap converge because there is little left to dilute. That is worth noting, but do not mistake it for a quality signal. Lower dilution risk does not make the FDV “good” on its own. It simply shifts the evaluation toward demand durability — whether there is any reason for sustained buying interest once the supply story is off the table.
Release Schedule Benchmarks
Regardless of token type, the pattern of token release changes what FDV is likely to overstate and what you should watch alongside it.
| Release pattern | What FDV tends to overstate | Primary risk window | What metric to pair with FDV |
|---|---|---|---|
| Cliff unlock | Near-term scarcity — FDV can understate how much supply concentration is about to shift on a single date | The days immediately surrounding the cliff date | Expected percentage increase in circulating supply over the 30 days following the cliff |
| Linear vesting | Long-run stability — FDV can look “converged” with market cap while a steady drip of new supply continues in the background | The full vesting window, not any single date | Expected percentage increase in circulating supply over a 90-day rolling window |
| Emissions-heavy | Organic demand — high activity may be emissions-subsidized rather than usage-driven | Ongoing, tied to how long incentive programs run before tapering | Current inflation rate and expected percentage increase in circulating supply over 180 days |
Each row points to a different question, but they share one framing principle: express upcoming dilution as an expected percentage increase in circulating supply over a defined time window — 30, 90, or 180 days — rather than as a raw token count.
Percentages travel across projects with wildly different supply distribution and denomination structures. Raw token amounts do not. That single adjustment is what makes FDV benchmarks genuinely comparable across the token types covered above, instead of merely internally consistent within one project’s own tokenomics.
Conclusion
Fully diluted valuation is a useful lens, but only when you understand exactly what it does and does not measure. On its own, FDV is a hypothetical ceiling — price multiplied by the total supply that will ever exist — not a live reading of what the market has actually assigned to a token today.
Used that way — as a screening and comparison tool rather than a standalone valuation — FDV earns its place in your research process without being mistaken for a verdict on where a token is headed next. In practice, FDV is best treated as one lens in a broader digital asset analysis stack that also considers liquidity, distribution, and real usage on the underlying blockchain network.
Get more insights into all things crypto from the ChangeHero blog and join the conversation on X, Facebook, or Telegram!
Frequently Asked Questions
What is FDV in crypto?
FDV, or fully diluted valuation, is a theoretical valuation that shows what a cryptocurrency would be worth if its entire eventual maximum supply were already circulating and priced at today’s rate. It is called theoretical because a portion of that supply is often not circulating yet — it may still be locked in vesting contracts, reserved for the team, or not yet minted at all.
How do you calculate FDV in crypto?
FDV is calculated with a simple formula: FDV = current price × maximum supply, using the token’s live market price and its hard-capped maximum supply as the two required inputs.
The wrinkle is that not every project publishes a clean maximum supply. When maximum supply is missing or uncapped, some data providers substitute total supply as a stand-in, which changes what the number actually represents. In those cases, label the calculation as a proxy rather than a true fully diluted maximum.What is the difference between FDV and market cap?
FDV values a token using its maximum supply, or sometimes total supply, while market cap values it using only circulating supply — the tokens actually tradable right now. The gap between the two is usually driven by locked allocations, vesting schedules, emissions, and other tokens that have not entered circulation yet.
Is high FDV good or bad in crypto?
High FDV is not inherently good or bad. It depends on how much of that valuation is already circulating versus still locked up. For a token that is nearly fully circulating, a high FDV is largely a reflection of current market pricing. For a low-float token with large unlocks still ahead, it can signal meaningful dilution risk.
Before drawing conclusions, check the unlock timing, expected float expansion, recipient category, liquidity, and whether the supply design includes ongoing token burns that could change how circulating supply trends over time.