Trading Patterns Cheat Sheet: 12 Essential Chart Patterns in One Place

Last week we made a guide to the most used basic chart patterns to start using technical analysis. As a follow-up, this week ChangeHero will complement that guide with a chart pattern cheat sheet and lay these figures out in concise illustrations. Make sure to save it!
How To Use This Trading Patterns Cheat Sheet
This guide should be considered additional material to our guide to crypto chart patterns. In the previous guide, we have described the basic chart patterns with their meaning and provided common trading strategies for them.
In this guide, we will break down these chart patterns into four categories: uptrend/downtrend and continuation/reversal patterns. Due to some chart patterns signaling different things depending on when they occur, there are multiple entries for the same stock chart patterns.
For the first time reading this guide, we recommend going through one category at a time, depending on which trading strategy you would like to familiarize yourself with.
Continuation Patterns Typical for Downtrend
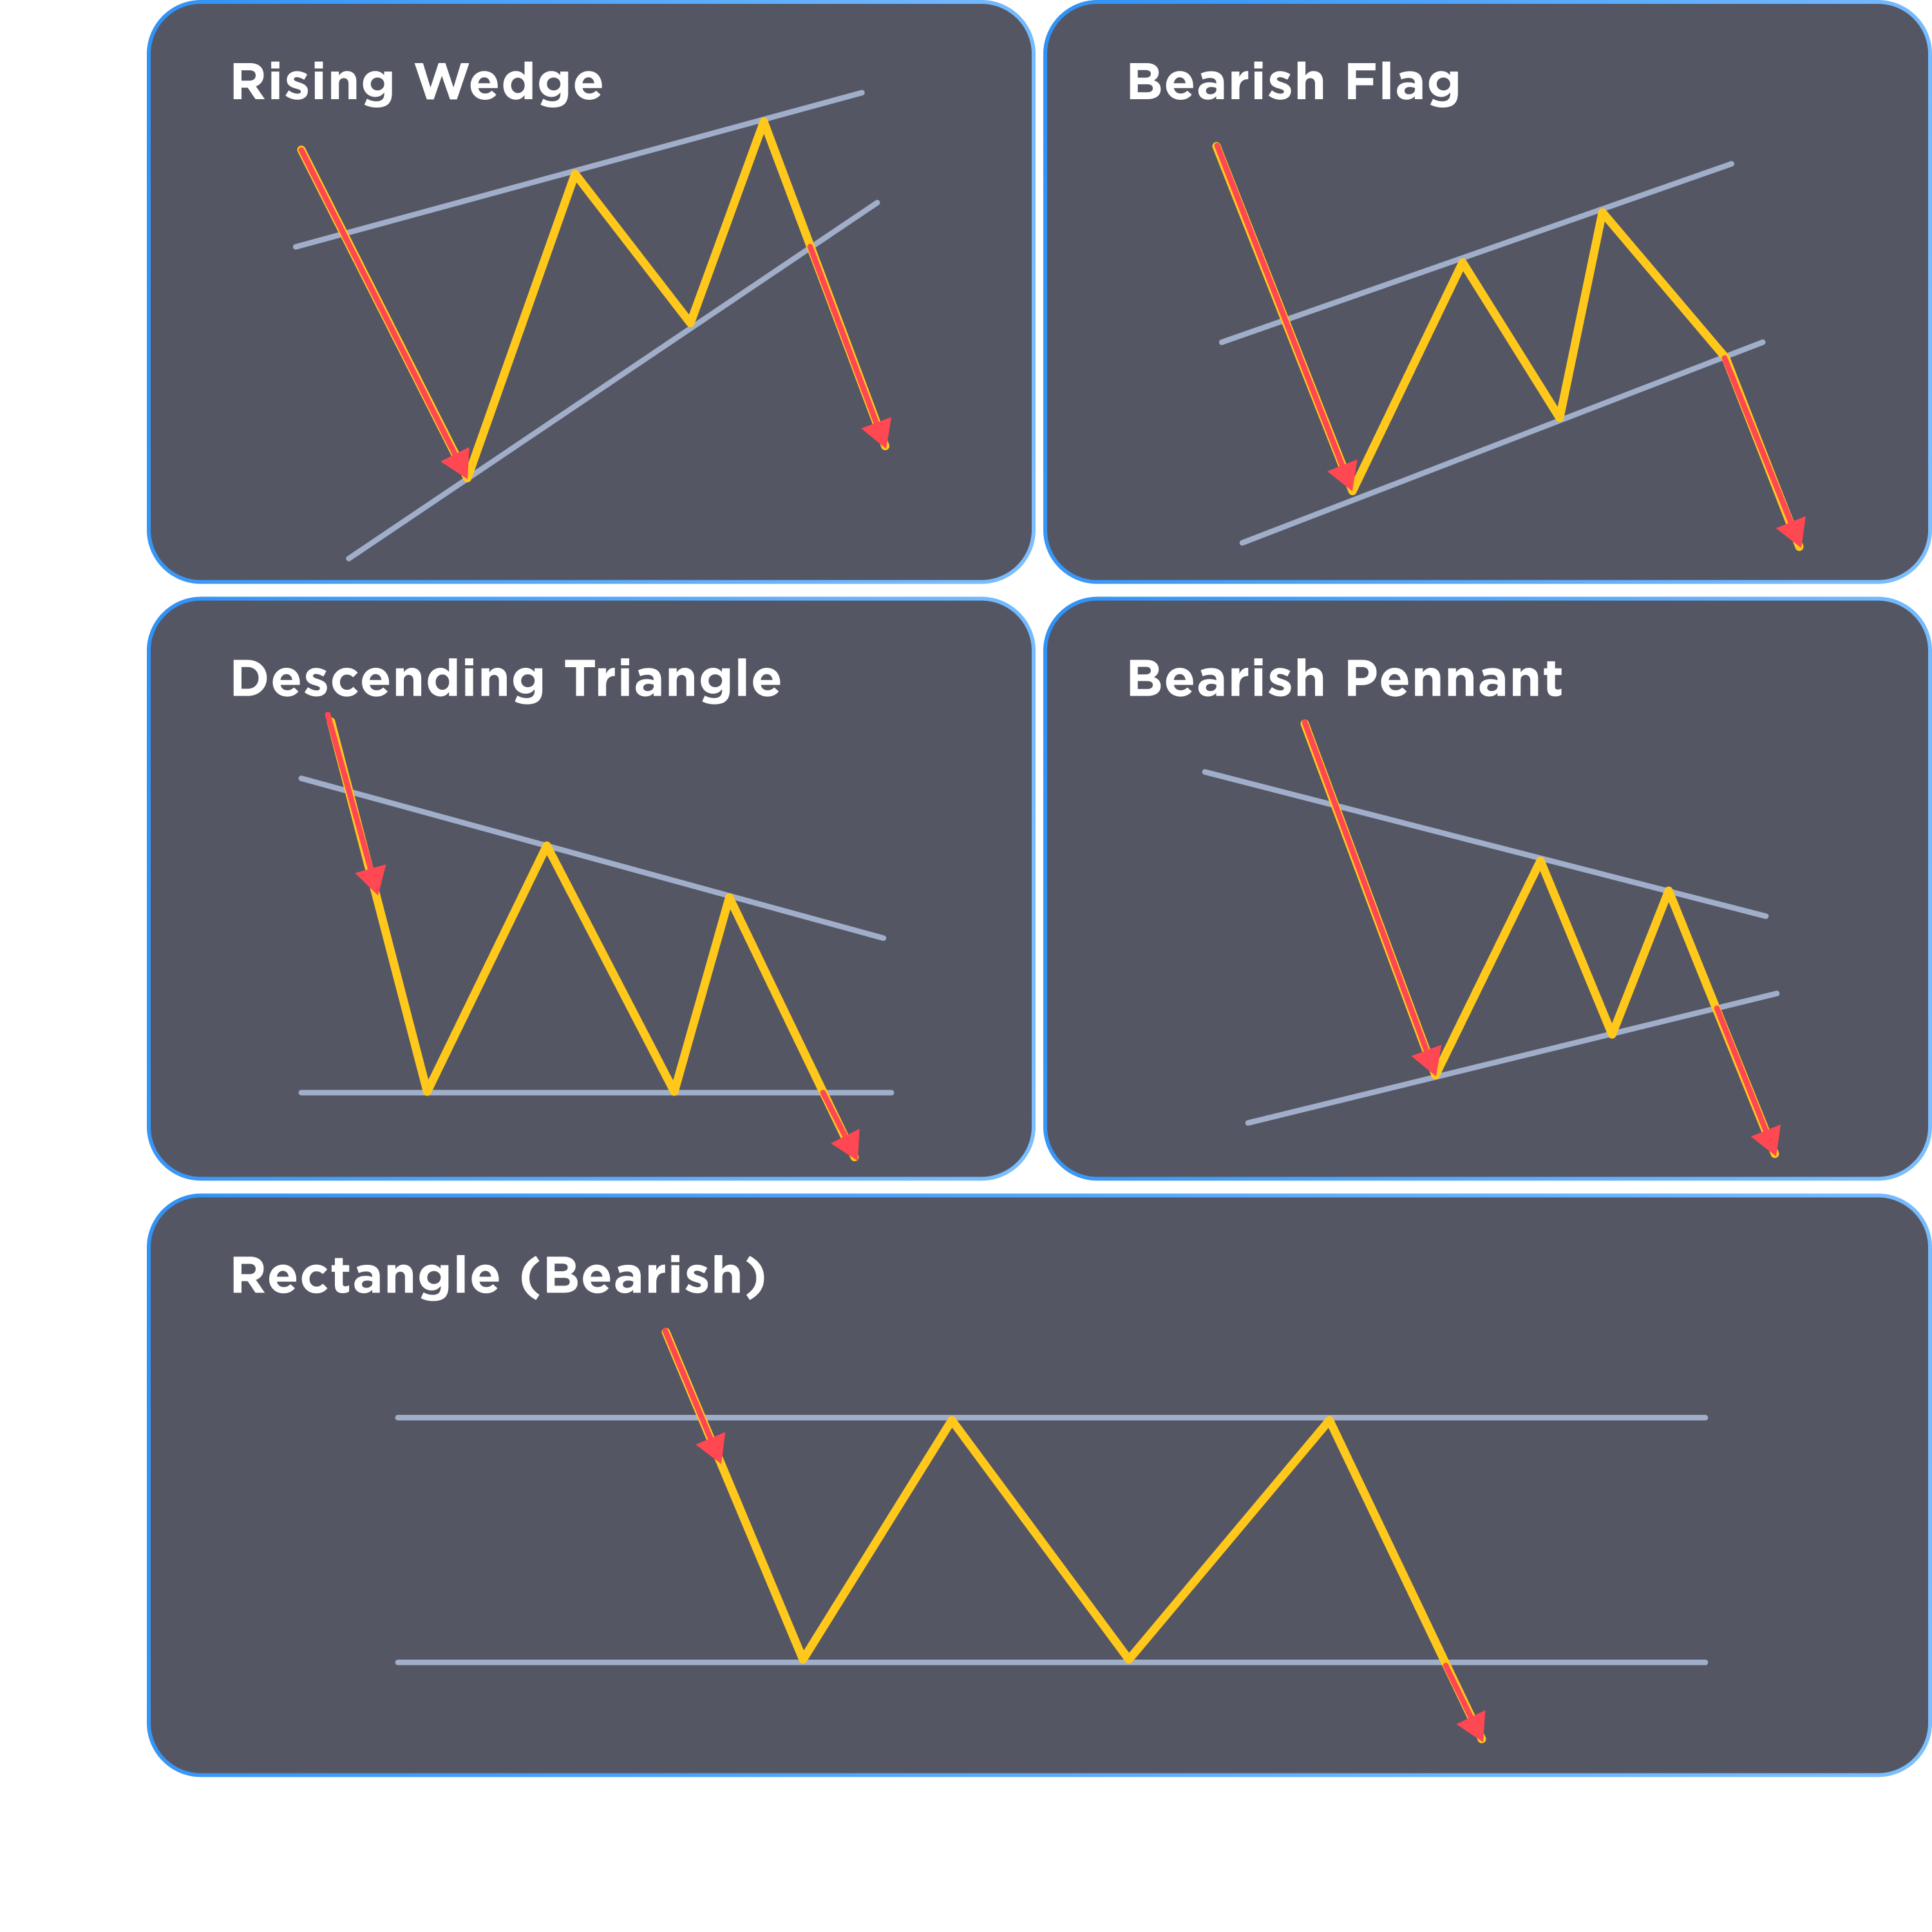
These patterns serve as technical indicators to signal a continuation of the trend. Due to occurring during a downtrend, this makes them bearish chart patterns. When such patterns are confirmed in time or with other indicators, traders usually follow up by holding or opening a short position.
Rising Wedge
A rising wedge pattern forms between the converging ascending resistance and support levels, with support being steeper. There is no defined number of trend line touches needed for the validation of the pattern.
A rising wedge pattern that occurs during a downward trend can look like a short-term uptrend. In reality, it points to that the existing trend will go on and therefore, is a continuation chart pattern. A more complete technical analysis that includes other indicators should help you determine the type of this pattern.
Bearish Rectangle
At its core, the rectangle is a neutral chart pattern. However, when it resolves in favor of sellers and the price goes down, it is considered bearish.
When the price bounces between the same resistance and support levels, appearing as parallel lines, for a while, you are looking at a rectangle. Applying additional technical analysis should help you understand which side will have the advantage as the pattern resolves.
Descending Triangle
A descending triangle pattern is shaped by a declining resistance level and a consistent support level. For this pattern to be considered valid, the price movements have to touch each side of the triangle at least twice.
Triangles are bilateral chart patterns, which means they can resolve in both a trend reversal and continuation. A descending triangle that sees a breakout below the support line reinforces a bearish trend.
Bearish Pennant
A pennant pattern appears similar to a wedge or a triangle shape: it is formed by two converging trend lines. The distinctive feature of a bearish pennant is a “pole”, formed by a large downward price move before the short-term consolidation.
Bearish pennants occur during a downtrend and even though briefly interrupt the existing trend, signal that it will continue.
Bearish Flag
A bearish flag pattern has the features of both pennants and channels. Like channels, which are bilateral patterns, they form between two parallel trend lines. However, flags are brief and resolved in a more predictable manner, continuing the previous trend.
Like pennants, flags also have poles — strong price movements that precede the pattern’s formation. The pole length is useful to determine the strength of the breakout. In this case, the breakout direction would be to the downside.
Reversal Patterns Typical for Downtrend
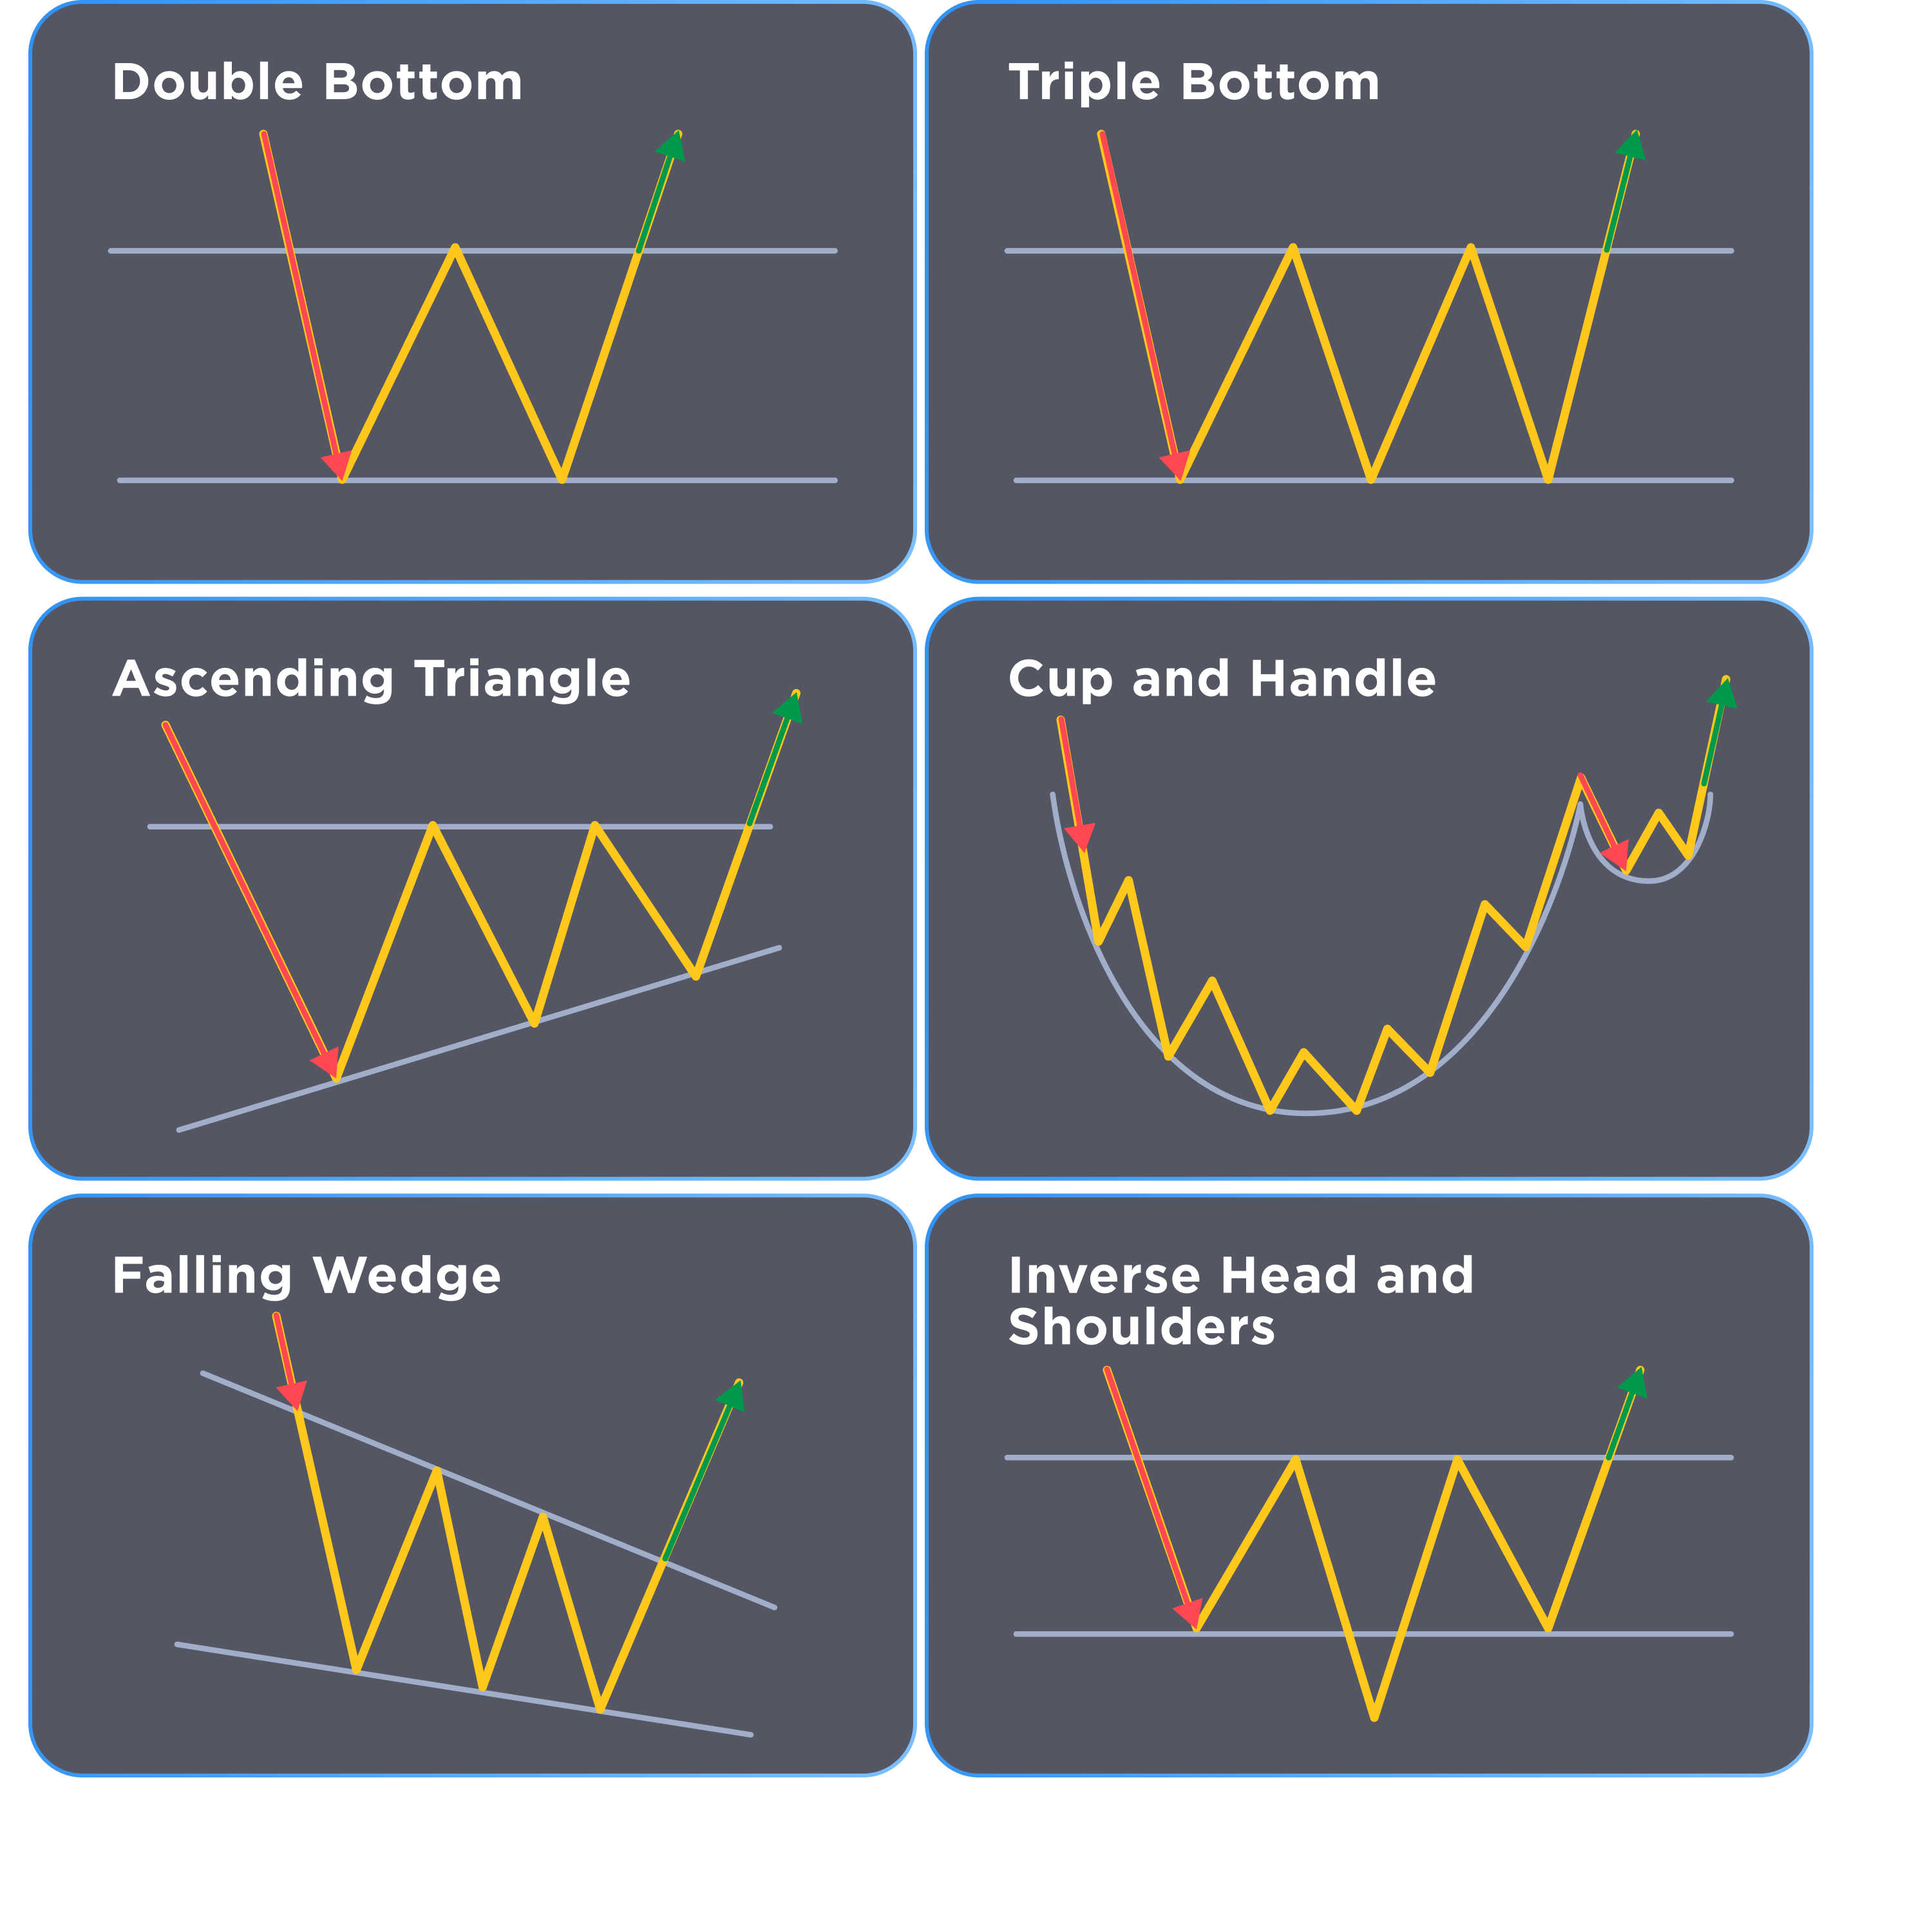
These patterns serve as technical indicators to signal a change in the price trend. Due to occurring during a downtrend, this makes them bullish chart patterns. When such patterns are confirmed in time or with other technical indicators, traders usually follow up by opening a long position.
Double/Triple Bottom
This pattern commonly emerges when it takes multiple tries (two or three respectively) for a trend direction to reverse. Its shape resembles the letter(s) “W” or “WV”, with intermittent resistance forming a neckline.
By the time this chart pattern emerges, it is clear that the trend is changing. Traders pay more attention to the height of the neckline to eyeball the next sharp price move.
Inverse Head and Shoulders
The inverse head and shoulders pattern resembles a triple bottom pattern, with a distinguishing difference that the first rejection from the neckline pushes the price below the support, which then gets retested. It is a classic bullish reversal pattern.
Falling Wedge
A falling wedge pattern is shaped by the declining resistance and support levels, with resistance being steeper. There is no defined number of trend line touches needed for the validation of the pattern.
A falling wedge pattern that occurs at the point of a downward trend exhaustion can be considered a reversal chart pattern. To understand whether the trend is about to finish, look at other technical indicators.
Ascending Triangle
An ascending triangle pattern is shaped by a rising support level and a consistent resistance level. For this pattern to be considered valid, the price movements have to touch each side of the triangle at least twice.
Triangles are bilateral chart patterns, which means they can resolve in both a trend reversal and continuation. An ascending triangle that sees a breakout above the resistance line introduces a bullish reversal.
Cup and Handle
Another classic chart pattern — cup and handle — is thought to be rather effective, although pinpointing it correctly can be challenging. It is observed over prolonged time frames and consists of a long U-shape move, followed by a short-term rejection at the neckline.
The cup and handle pattern is a sign that a downtrend is over, and a stronger move to the upside is about to happen. As such, it is a bullish pattern.
Continuation Patterns Typical for Uptrend
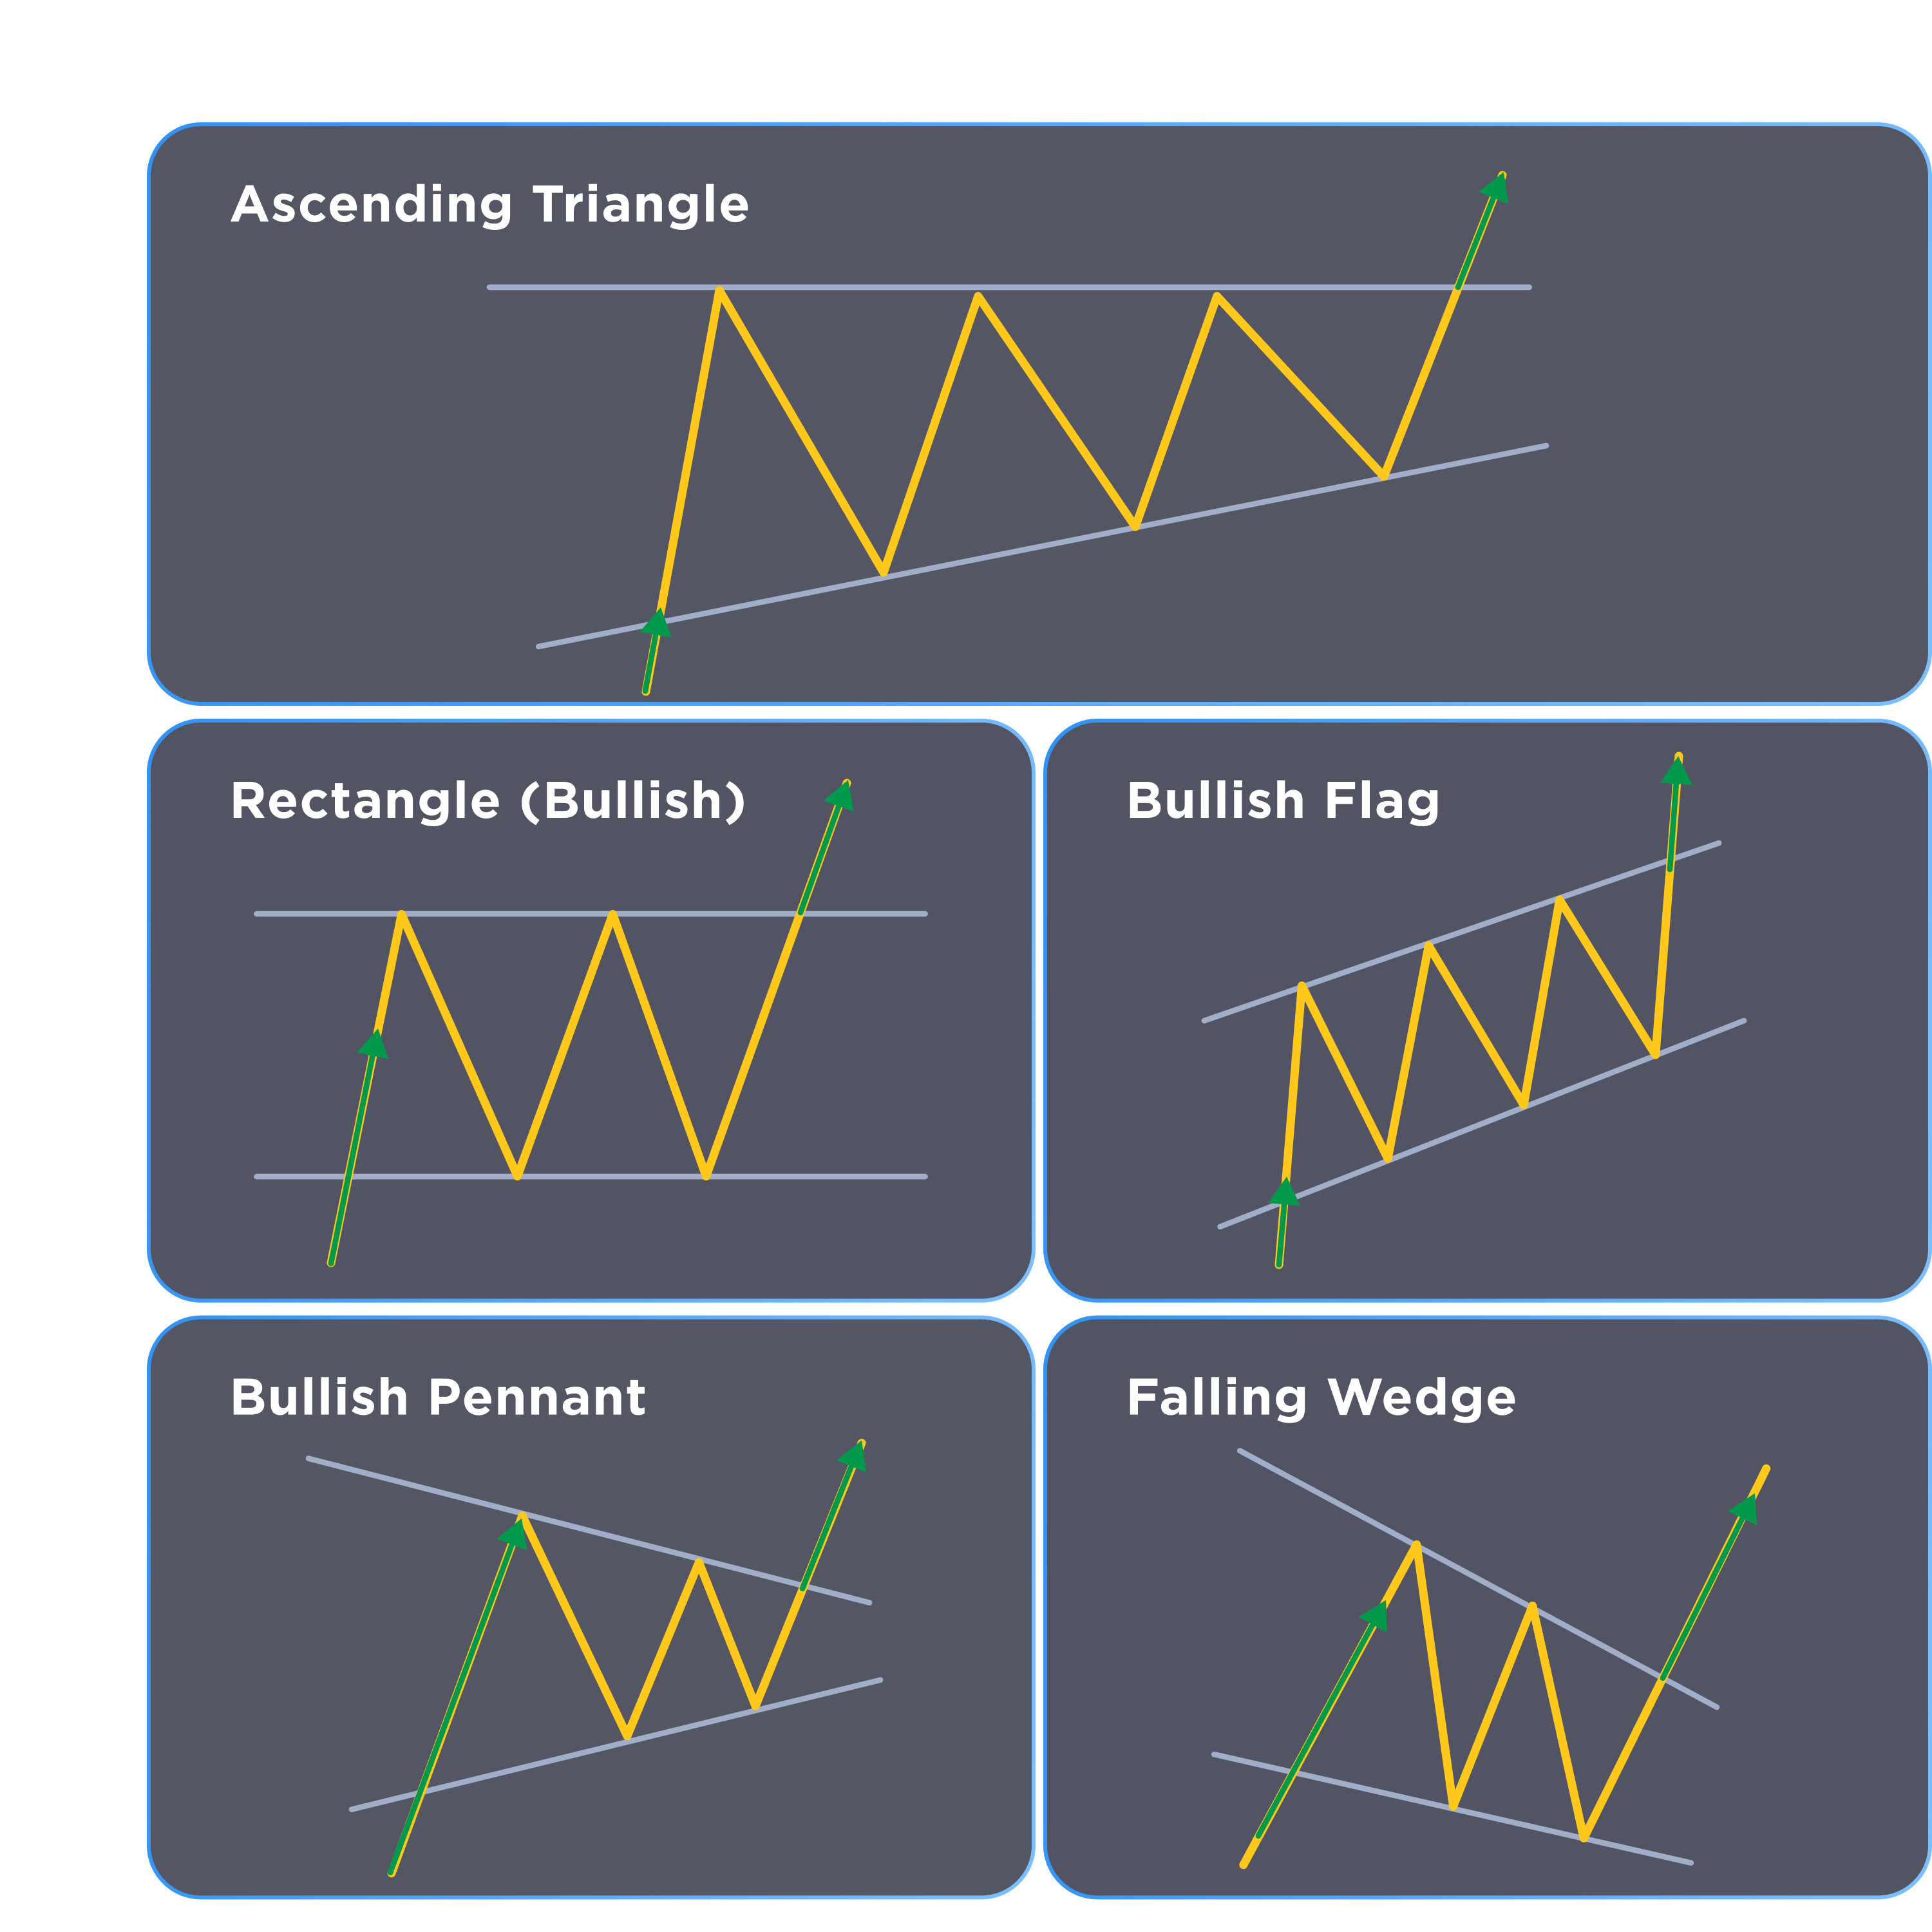
These patterns serve as technical indicators to signal a continuation of the existing uptrend. Due to occurring during an uptrend, this makes them bullish chart patterns. When such patterns are confirmed in time or with additional technical indicators, traders usually follow up by holding or opening a long position.
Falling Wedge
A falling wedge pattern forms between the declining support and resistance levels, with resistance being steeper. There is no defined number of trend line touches needed for the validation of the pattern.
A falling wedge pattern that occurs during an upward trend can look like a short-term downtrend. In reality, it points to that it will go on and therefore, is a continuation chart pattern. A more complete technical analysis that includes other indicators should help you determine the type of this pattern.
Bullish Rectangle
In a vacuum, the rectangle is a neutral chart pattern. However, when it resolves in favor of buyers and the price goes up, it is considered bullish.
When the price bounces between the same resistance and support levels, appearing as parallel lines, for a while, you are looking at a rectangle. Applying additional technical analysis should help you understand which side will have the advantage as the pattern resolves.
Bullish Pennant
A pennant pattern appears similar to a wedge or a triangle shape: it is formed by two converging trend lines. The distinctive feature of a bullish pennant pattern is a “pole”, formed by a large upward price move before the short-term consolidation.
Bullish pennants occur during an uptrend and even though briefly interrupt the existing uptrend, signal that it will continue.
Bullish Flag
A bullish flag pattern has the features of both pennants and channels. Like channels, which are bilateral patterns, they form between two parallel trend lines. However, flags are brief and resolved in a more predictable manner, continuing the previous trend.
Like pennants, flags also have poles — strong price movements that precede the pattern’s formation. The pole length is useful to determine the strength of the breakout. In this case, the breakout direction would be to the upside.
Ascending Triangle
An ascending triangle pattern is shaped by a rising support level and a consistent resistance level. For this pattern to be considered valid, the price movements have to touch each side of the triangle at least twice.
Triangles are bilateral chart patterns, which means they can resolve in both a trend reversal and continuation. An ascending triangle that sees a breakout above the resistance line reinforces a bullish trend.
Reversal Patterns Typical for Uptrend
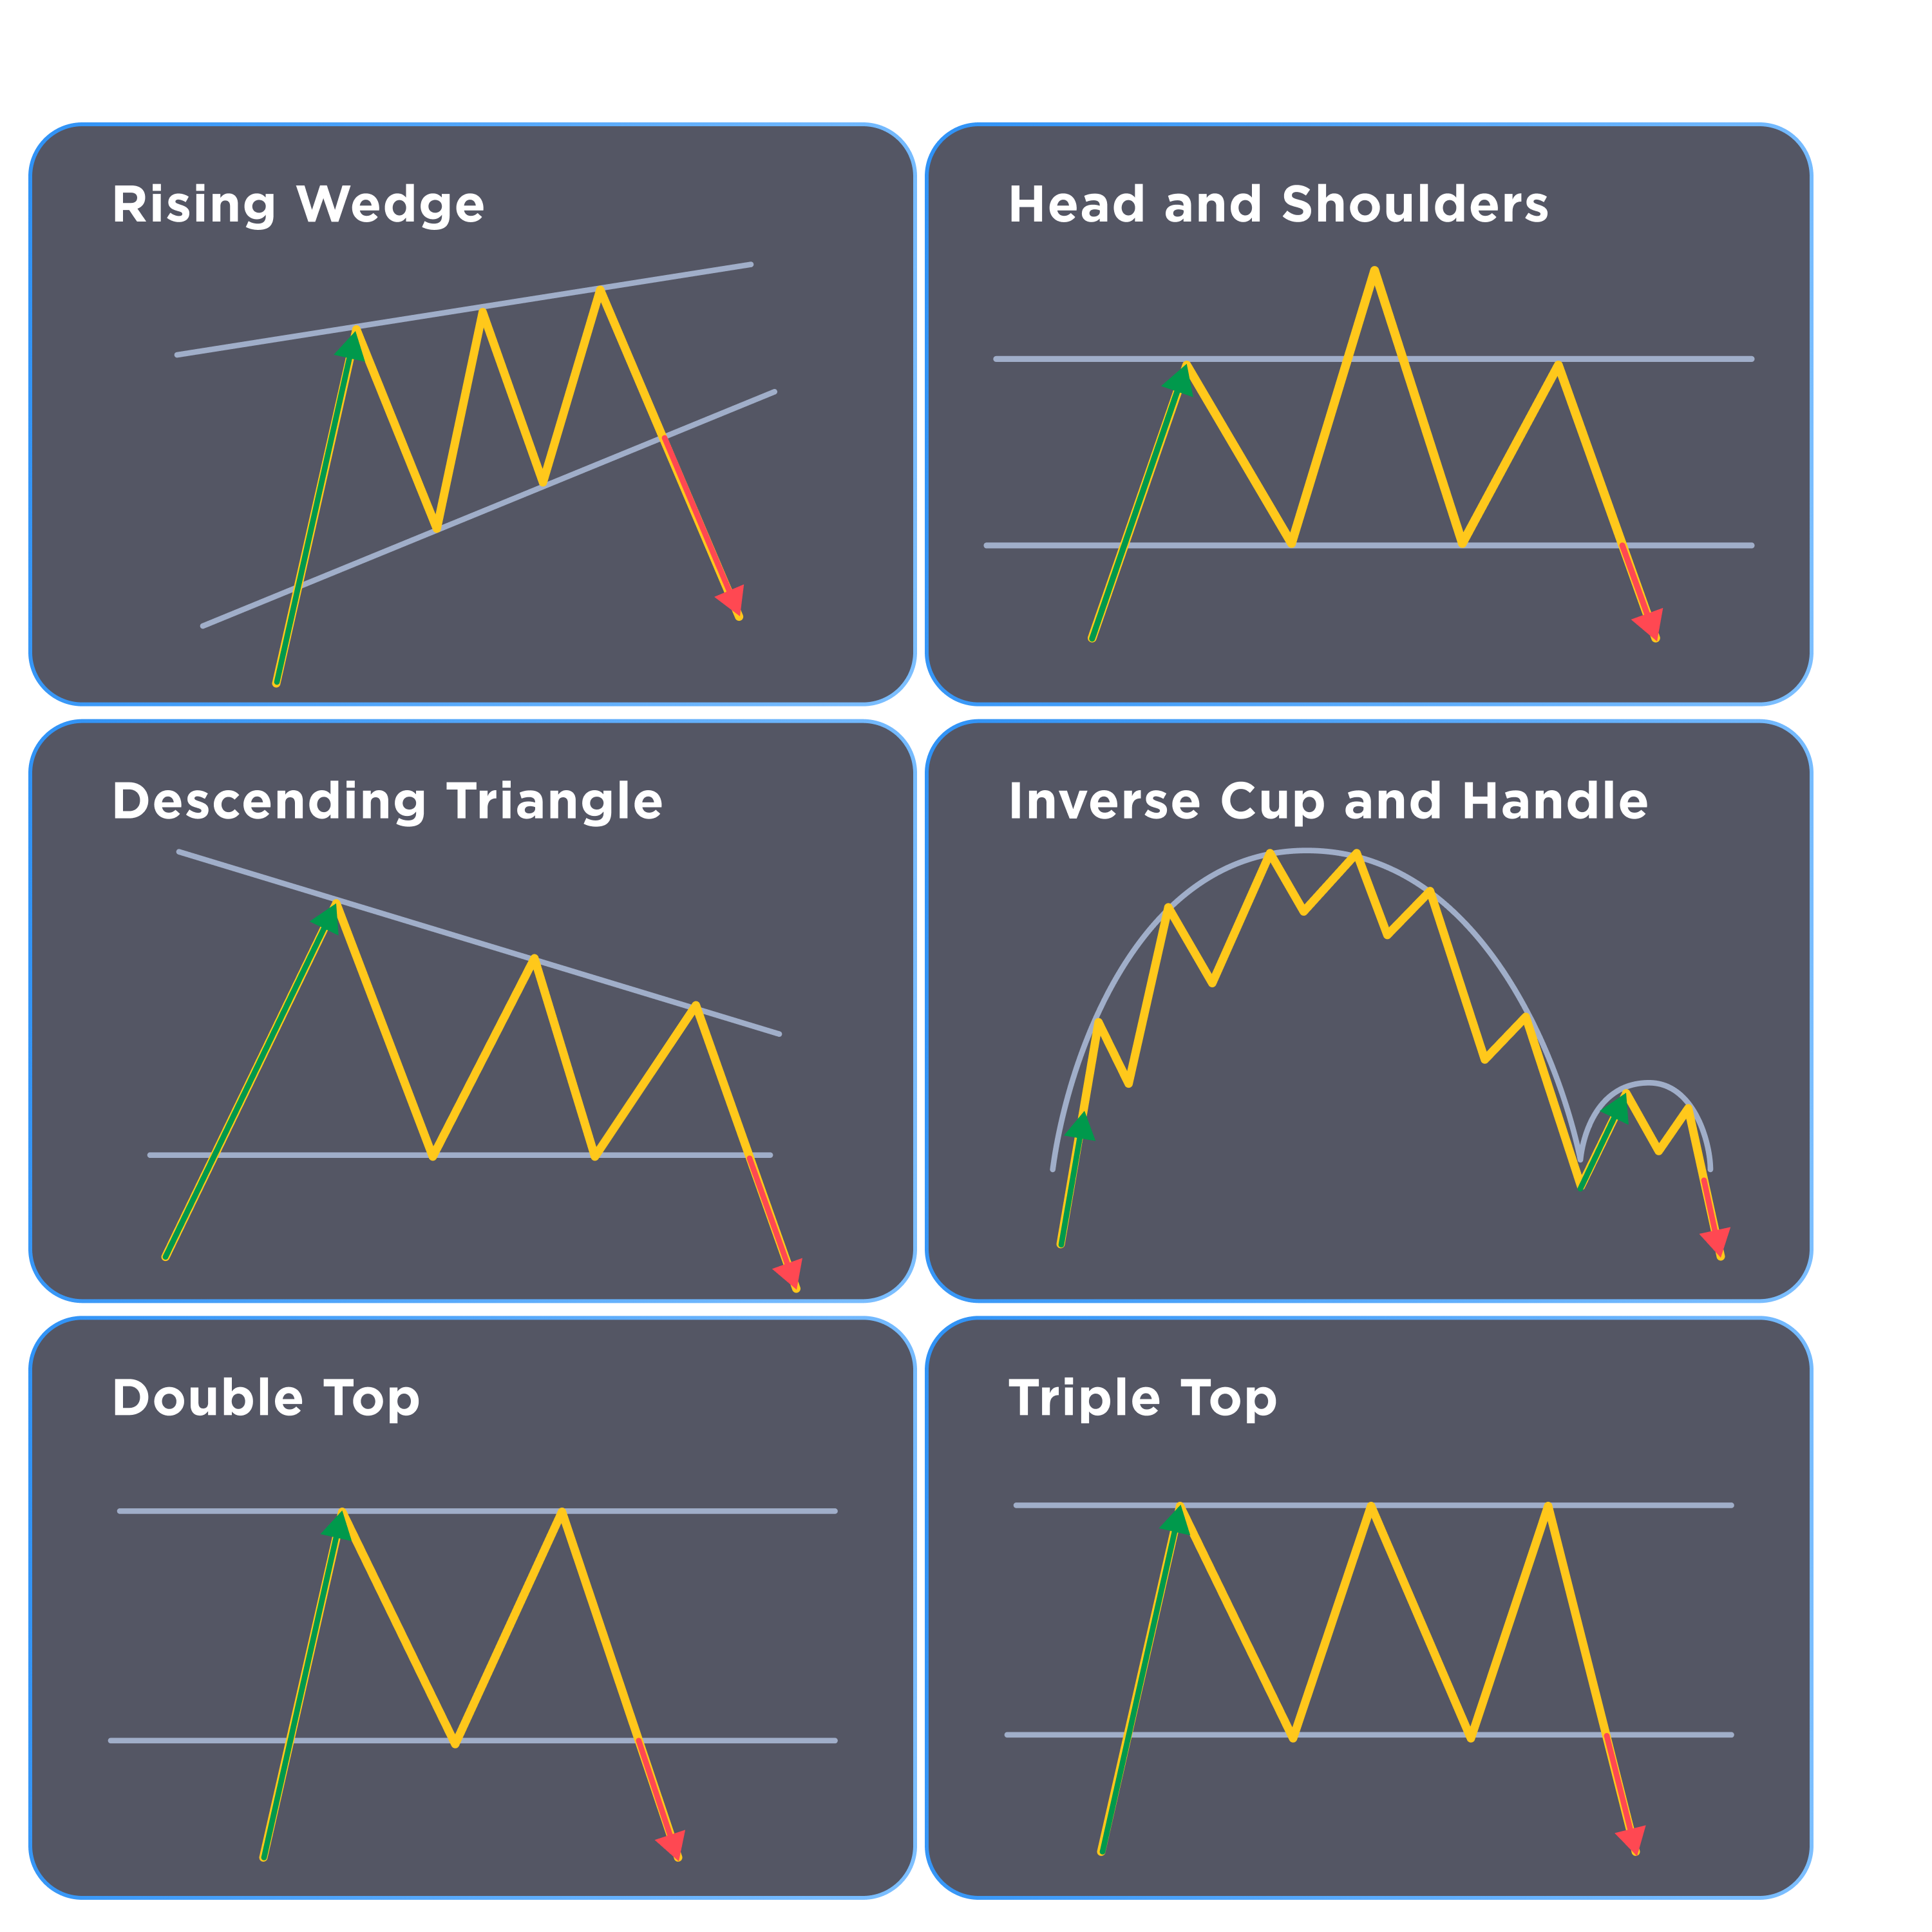
These patterns serve as technical indicators to signal a change in the price trend. Due to occurring during an uptrend, this makes them bearish chart patterns. When such patterns are confirmed in time or with additional technical indicators, traders usually follow up by opening a short position.
Double/Triple Top
This pattern commonly emerges when it takes multiple tries (two or three respectively) for a trend direction to reverse. Its shape resembles the letter “W” or a crown with three tops, with intermittent resistance forming a neckline.
By the time this chart pattern emerges, it is clear that the trend is changing. Traders pay more attention to the height of the neckline to eyeball the next sharp price move.
Head and Shoulders
The head and shoulders pattern resembles a triple top pattern, with a distinguishing difference that the first recovery from the neckline pushes the price up above the resistance, which then gets retested. It is a classic bearish reversal pattern.
Rising Wedge
A rising wedge pattern forms between the ascending support and resistance levels, with support being steeper. There is no defined number of trend line touches needed for the validation of the pattern.
A rising wedge pattern that occurs at the point of an upward trend exhaustion can be considered a reversal chart pattern. To understand whether the trend is about to finish, watch other technical indicators.
Descending Triangle
A descending triangle pattern is shaped by a rising resistance level and a consistent support level. For this pattern to be considered valid, the price movements have to touch each side of the triangle at least twice.
Triangles are bilateral chart patterns, which means they can resolve in both a trend reversal and continuation. A descending triangle that sees a breakout below the support line introduces a bearish reversal.
Inverse Cup and Handle
Although the cup and handle pattern is usually considered a bullish reversal pattern, some traders also observe an inverse variation of this chart pattern. As an opposite to this pattern, it consists of a rounded, U-shaped top, followed by a short surge above the shape’s neckline.
The inverse cup and handle pattern is a bearish pattern and a sign that an upside trend has been exhausted. The “handle” part confirms the chart pattern and is believed to be followed by further price movement to the downside.
Complete Crypto Chart Pattern Cheat Sheet
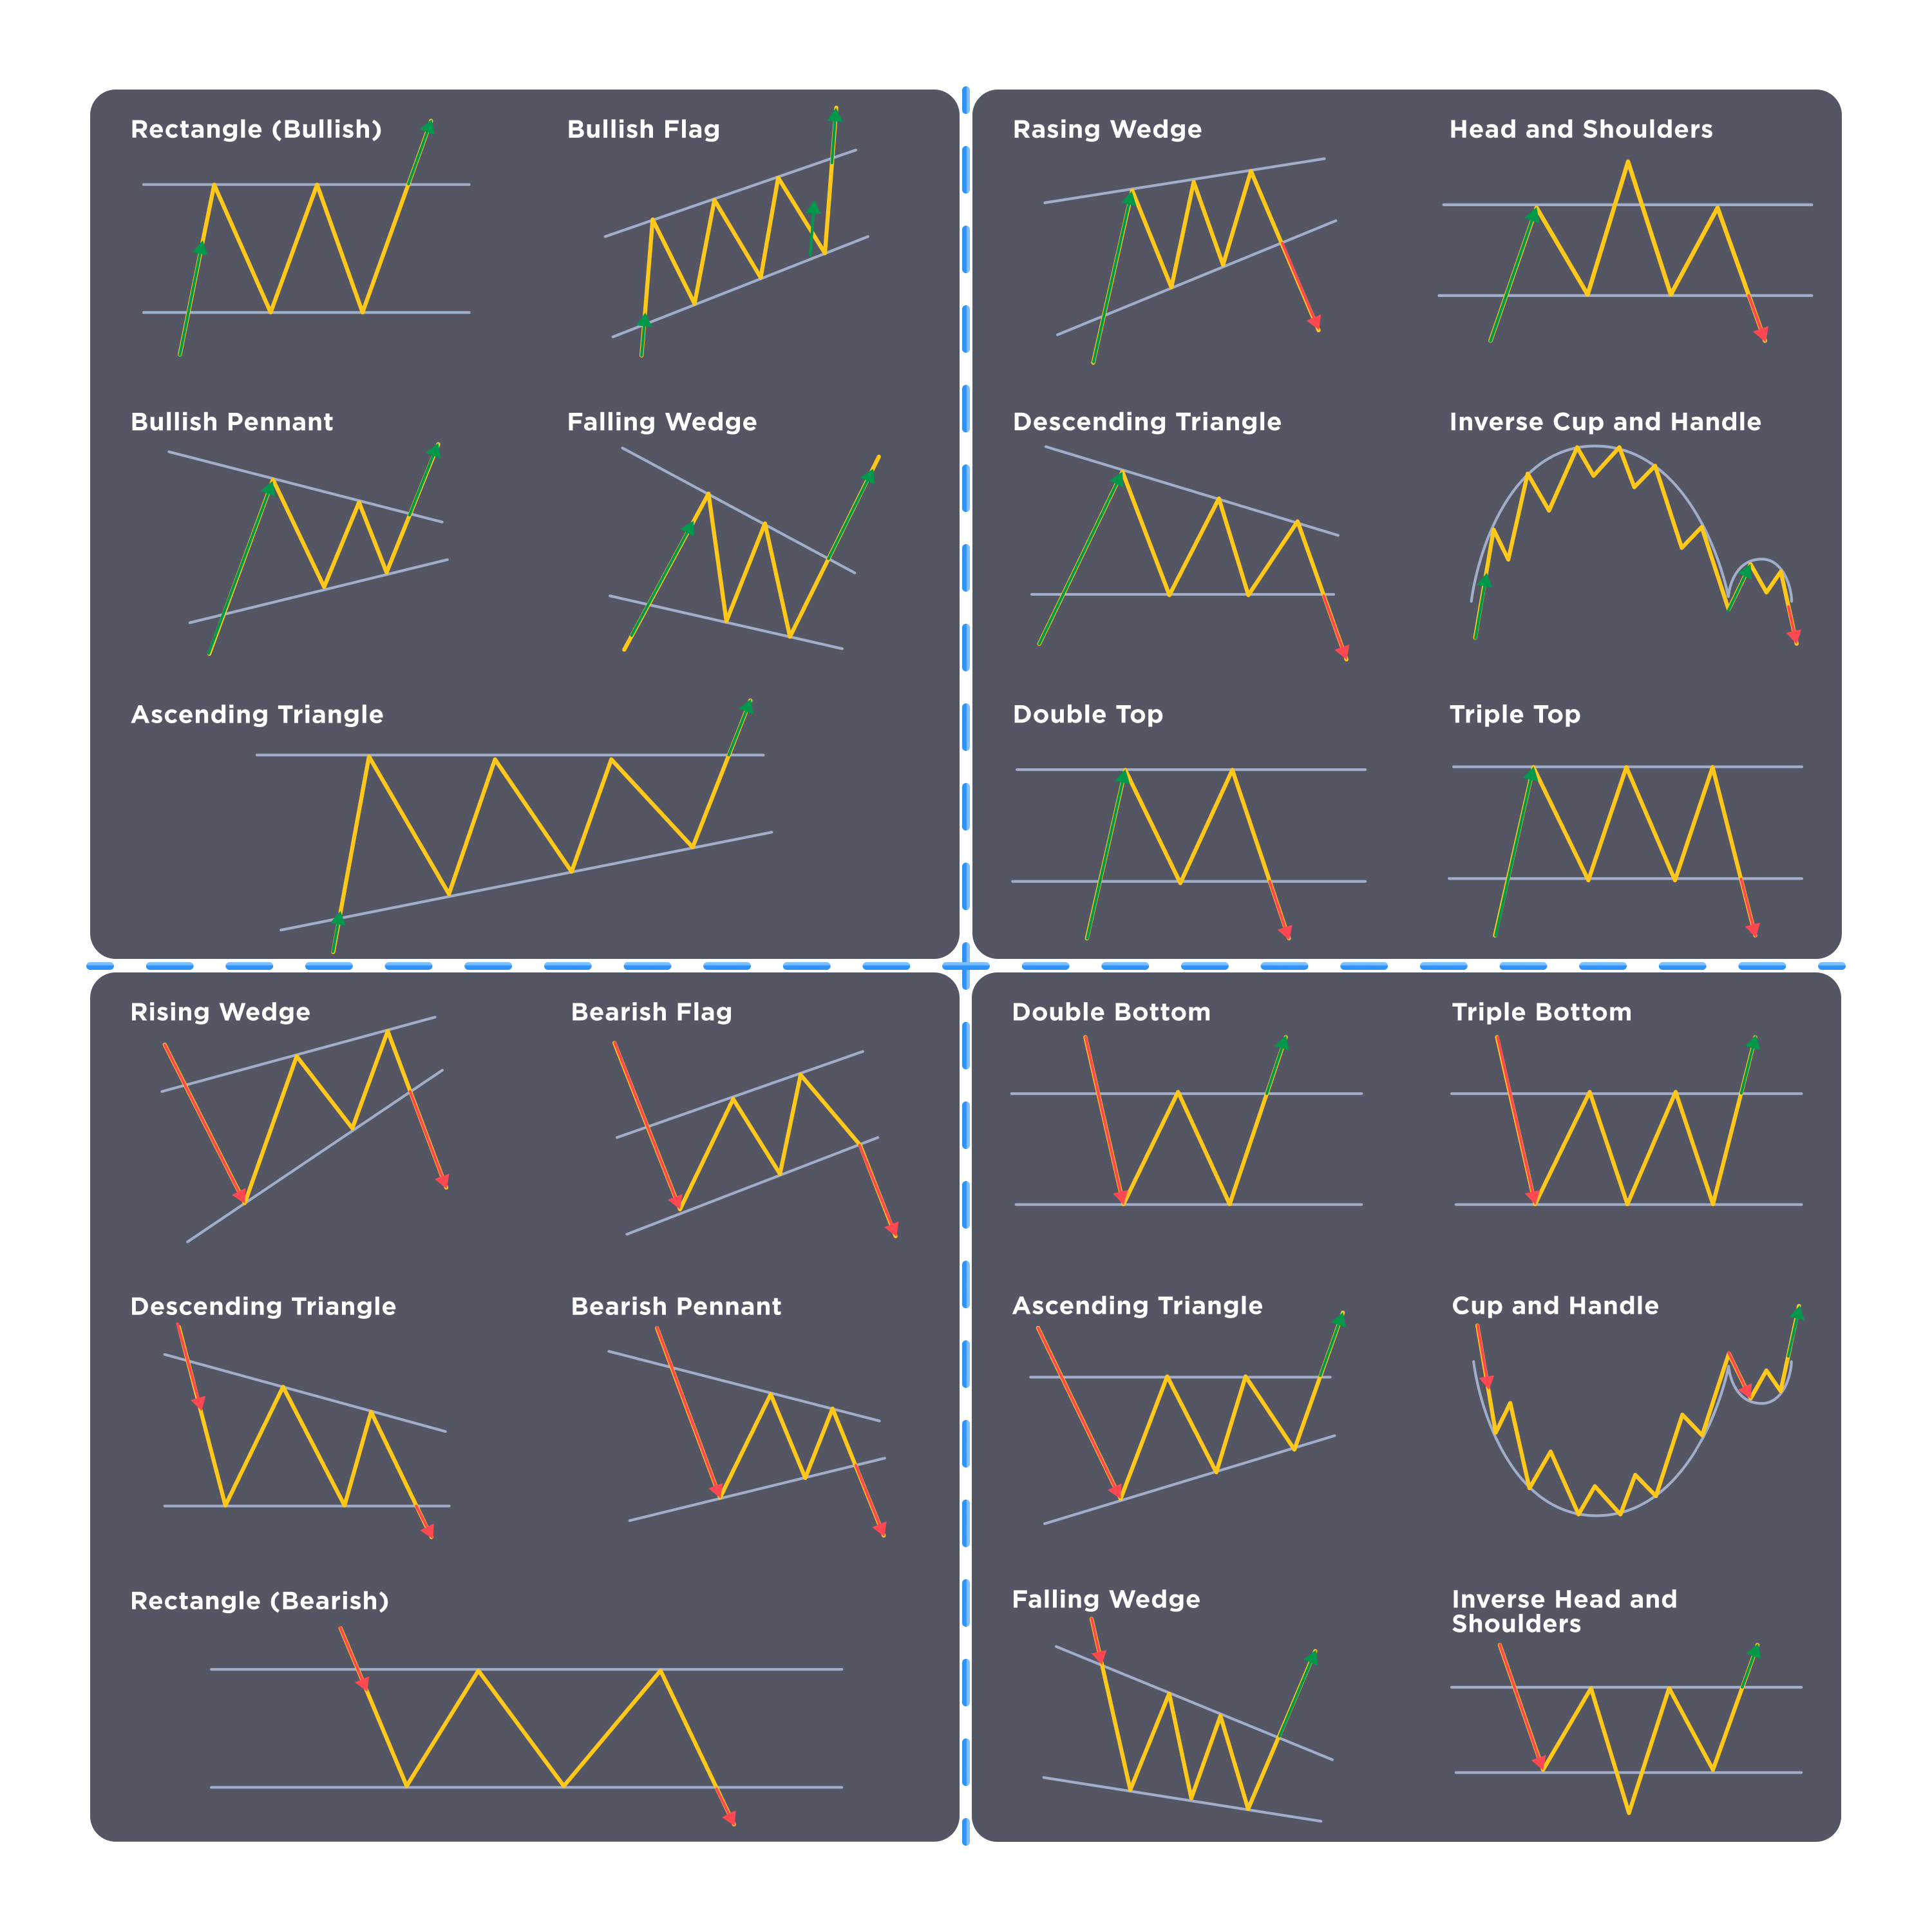
And here is a complete cheat sheet of charting patterns that we have reviewed (of course, it is a free download with a right-click😉). Do not forget that you will find a complete explanation of these and more, together with trading strategies in our guide to common chart patterns.
When analyzing charts, patterns are a handy tool but not a rock-solid one. Despite the past market data backing up the theory behind this type of chart analysis, it relies on probabilities rather than rules and certainties.
It is recommended to reference more indicators and factors in addition to chart patterns: moving average, relative strength index, and MACD. Moreover, keeping up with the news and market trends and performing fundamental analysis of the asset will help you avoid wasting time looking for unfeasible patterns.
Conclusion
We hope our chart pattern cheat sheet and this guide come in handy for making the right trading decisions! Feel free to save it for future reference and share it around.
For more educational content about the crypto world, keep an eye on ChangeHero blog. ChangeHero’s social media team shares insights on Telegram, X (Twitter), and Facebook, too — subscribe not to miss out on anything!
Frequently Asked Questions
What is the most effective pattern in trading?
There have been attempts to measure the efficiency of chart patterns and compare them. One of them suggests that the most effective one out of the most common chart patterns is inverse head and shoulders with an 86% success rate.
Do trading patterns always work?
Chart trading patterns are not guaranteed to work in all cases, even if identified correctly. They are built off past market data and operate with probabilities rather than certainty.
How do you recognize chart patterns easily?
To be able to identify chart patterns with ease, you probably need to gain plenty of experience in this task. Knowing which chart patterns occur under which conditions and having a chart pattern cheat sheet on hand can help, too.