Charting the Path to Trading Success — Beginner’s Guide to Crypto Chart Patterns

Contents
- 1. Key Takeaways
- 2. How to Read Crypto Charts for Absolute Beginners
- 3. What is The Difference Between Stock Trading Patterns vs. Crypto Patterns?
- 4. What Cryptocurrency Chart Patterns Can Tell You
- 5. Reversal Patterns: Cup and Handle, Diamonds, Wedges, Head and Shoulders
- 6. Continuation Patterns
- 7. Rhythmic Patterns
- 8. Cheat Sheet for the Crypto Patterns
- 9. How Reliable are Chart Patterns?
- 10. Conclusion
Have you ever been intrigued by the way traders seemingly can predict price changes with mysterious arrows, shapes, and patterns? There is nothing random about it: they are using the ages-old know-how of stock market traders. In this guide, the ChangeHero team will demystify their tools, so you will be able to use chart patterns to capitalize on crypto price dynamics, too.
Key Takeaways
- Like in the stock market, prices in the crypto market do not move randomly: they follow the same principles. As such, the chart patterns that originated in stock market technical analysis, based on crowd psychology, work here, too;
- Some chart patterns show when a trend is about to change or reverse. They include cup and handle, head and shoulders, wedge and diamond patterns;
- The other type of pattern signals a trend continuation. Triangle, channel, rectangle, flag, and pennant patterns belong to this kind.
How to Read Crypto Charts for Absolute Beginners
Reading this guide to learn how to read crypto charts for day trading or similar complex modes? Looking for a cheat sheet with patterns for day trading crypto? Feel free to skip ahead for a bit! This paragraph is for those who still feel any confusion about what exactly the crypto price chart is showing.
Let’s unpack how to read crypto charts explained for beginners from the very basics. A standard price chart is a line graph with price on the vertical axis and time on the horizontal one.
In our example, the horizontal axis is broken down by days, hence the daily time frame. The vertical axis is zoomed in to show the price range between $75,000 and $120,000 dollars.
Although you can make the graph look like a regular line, area, or column chart, the most common presentation uses candlesticks because they tell you the most at a glance. They tell where the price has moved and how much it has changed during the specified session or time frame. The thick portion of the candle shape is the difference between the opening and closing prices. Thin lines represent the highest and lowest prices within that time. Some traders even analyze candlestick patterns to identify trend shifts or continuations.
Price charts often present additional information, such as trading volume in this example. Here, it is presented as a bar chart and colored corresponding to the candle color which represents the same day. Traders can add even more indicators as they master what crypto charts as a tool is and learn to use more sophisticated means to inform their decisions and analysis.
How to read crypto trading charts though? The short answer is you’ve already halfway there. Keep reading for the longer answer!
What is The Difference Between Stock Trading Patterns vs. Crypto Patterns?
There is no huge secret behind crypto chart patterns — they are virtually the same as the ones originating from the stock market. It shouldn’t be too surprising: the price chart structure with candles to indicate the prices is essentially the same here!
A crucial difference between the stock market and crypto markets is that the latter works without closing around the clock. This does not seem to have any influence on the way these markets work, and other than that, the crypto trading experience is generally the same.
It is true that cryptocurrencies have some indicators unique to this type of asset and therefore, trading crypto. It mostly concerns the on-chain metrics, such as network activity or the number of addresses. When it comes to crypto chart patterns, though, there is no evidence that they are any different from the original stock patterns. And luckily, there are a lot of accessible materials and crypto graphics to teach you about those — this guide included.
What Cryptocurrency Chart Patterns Can Tell You
Generally speaking, chart patterns applicable to cryptocurrency markets are divided into several categories depending on what they are useful for. Some patterns are helpful to indicate a trend continuation, while others can signal that a trend is about to change. They are categorized as continuation and trend reversal patterns, respectively.
Likewise, there are trends that act as bullish and bearish signals. Both continuation and reversal patterns can be either bullish or bearish, depending on when they occur. A Bitcoin chart pattern can double as a bullish signal if it indicates the continuation of an uptrend or a reversal of a downward trend. The same goes for bearish patterns.
There is a category of traders who capitalize on the changes in price — swing traders. They are typically on the lookout for reversal patterns. However, continuation patterns are equally informative to them: if they notice one, they wait it out or correct the course of action.
Should you watch for any signals if you are not a day trader? Most Bitcoin chart patterns can be applied to different time frames, so even if you trade only occasionally, you can keep an eye on daily or weekly charts.
How to read crypto trade signals is another question. Ideally, you should be able to identify the signals as they form, but how do you acquire the cryptocurrency chart analysis skill? Practice is key but before that, you should also know what exactly to look for. Let us list and describe the most common crypto chart patterns with their meaning.
Reversal Patterns: Cup and Handle, Diamonds, Wedges, Head and Shoulders
There are multiple cryptocurrency chart patterns that point to a potential reversal of a trend: after their formation, the price movement usually changes its direction. By noticing these patterns on a crypto graph, you can anticipate when the price of an asset will shoot up or dump.
Cup and Handle

One of the most well-known and effective signs of a trend change is a cup-and-handle pattern. It looks like a U-shape, with the price dipping, slowing down and consolidating, and slowly getting back up. The second part of the cup and handle pattern is a sharp rejection or a brief downtrend that forms the handle.
The pattern usually resolves with a breakout to the upside, so “cup and handle” is a bullish pattern. Traders usually place buy orders after the pattern is confirmed with this breakout from the “handle”. Another helpful indicator that cup-and-handle provides is how long you should go: the usual target is the depth of the “cup”.
Rounded Top and Rounded Bottom

The rounded bottom is a similar crypto pattern but it does not have the “handle” part. Instead, the price gradually breaks out above the neckline. This pattern leaves a lot to the trader’s interpretation, so it is not very reliable. Nevertheless, those who use it place their orders after a successful breakout at the same height as the difference between the bottom and the neckline. A rounded top pattern is also sometimes observed, meaning the inverse of this pattern.
Head and Shoulders Pattern

Another well-known and recognizable pattern is “head and shoulders”. It exists in two variations, normal (which is bearish) and inversed (bullish). The head and shoulders chart pattern has three peaks (or bottoms), with the second one being higher (or lower) than the first and the third ones. The support (or resistance) levels the price pulls back to between the peaks is called the neckline.
A common strategy after a head and shoulders pattern has resolved is to place an order at the height of the head to the neckline.
Triple Top/Bottom, Double Top and Double bottom pattern
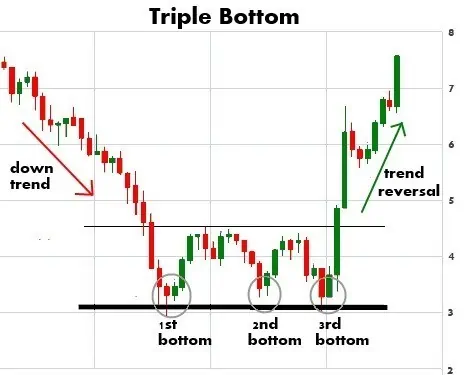
Double top or double bottom (also known as “W pattern”) crypto pattern and triple top or bottom are similar to the pattern described above. They occur under similar circumstances when the buyers and sellers are trying to one-up each other. A noticeable difference is that the second or third attempts land at the same support or resistance levels as the previous ones.
The bounces during the formation of this pattern form a neckline, and traders place the first target after seeing it on the chart at the same depth as the neckline and support/resistance.
Rising/Falling Wedges

The next chart pattern takes a bit longer to form. Wedges are in between channels and triangles in shape but unlike them signal a reversal. A rising wedge is formed between a rising resistance level and a steeper support, and a falling wedge is formed by a declining support level and a steeper resistance. Unlike the previously described crypto graph patterns, for wedges, there is no definite number of touches between the lines. These patterns occur both halfway through and at the point of exhaustion of a trend, or amid a short-term trend change. The resulting breakout can take the price of an asset to at least the level at which the second touch of the wedge took place.
Diamonds
Another reversal pattern worthy of mention is diamond: it can be tricky to spot in the making, so it is not as popular. A bearish diamond at the market top is believed to occur more frequently than a bullish diamond at the bottom. This pattern is different from the rest because it is not confirmed once it is fully formed. Only when the price reaches the diamond height after the breakout, do traders place their orders.
Continuation Patterns
Chart patterns that don’t signal a trend change can be helpful in crypto as well. They help traders determine whether to keep holding or take profits.
Rectangle chart pattern

When you see the price bouncing between the same support and resistance levels for a while, you are looking at a rectangle pattern. It is a neutral pattern, since the stalemate between buyers and sellers, in which no side has a clear advantage, can be resolved either way. The only thing you can expect for certain is that a breakout after this consolidation will be powerful.
Channels
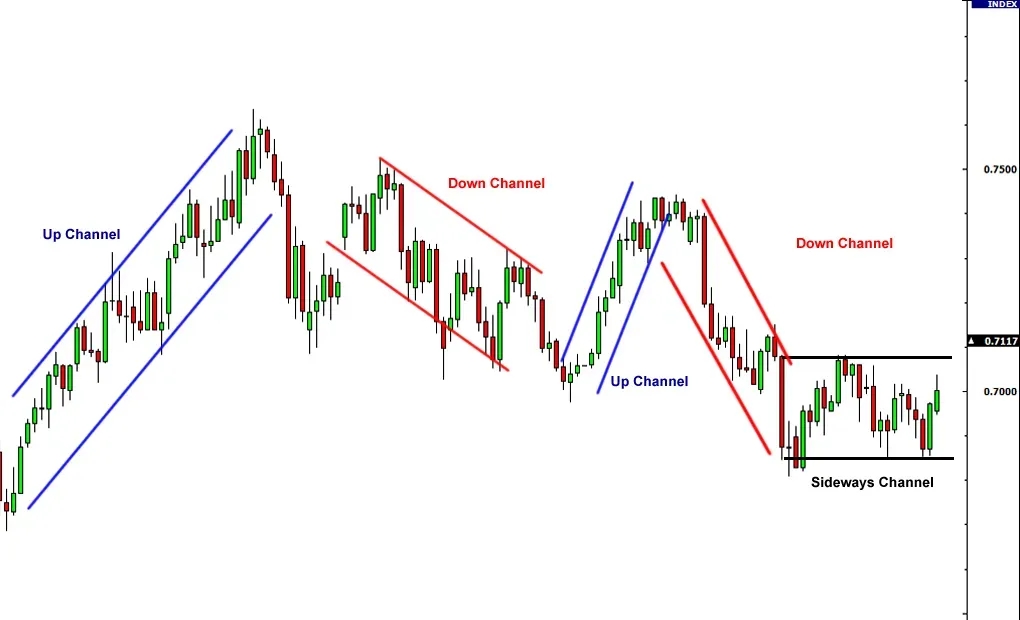
If the support and resistance levels are rising or descending in parallel to each other, it is a pattern typical for consolidation phases as well — a rising or descending channel. Unlike rectangles, these patterns demonstrate the influence of a larger trend but channels are also neutral and show indecision on both sides. Channels are easier to pinpoint because to be considered valid, the price has to touch each trend line at least three times. Like with rectangles, the stalemate can be resolved either way, but there is a slightly higher probability that a breakout will be in the opposite direction to the trend direction.
Flags

A chart pattern that looks like a channel is a flag: it is also formed by two parallel trend lines on crypto trading charts. Flags can be bullish or bearish crypto patterns and have two important distinctions from channels. Firstly, a flag is a short-term pattern, forming for a few weeks at most. Secondly, it has to have a “pole” part: a large move up or down that precedes the short-term volatility.
Flags often interrupt impulse moves but resolve in continuation. A common strategy is to take the height of the pole and place an order at the breakout plus the pole size. Flags can also form series, and the second flag will usually be sharper than the first.
Pennants

When the price moves similarly but the trend lines between which the price is bouncing are converging, this pattern is called a pennant. Unlike a wedge or a triangle, it is also preceded by a strong move forming a pole. The strategy is the same as with a crypto flag pattern.
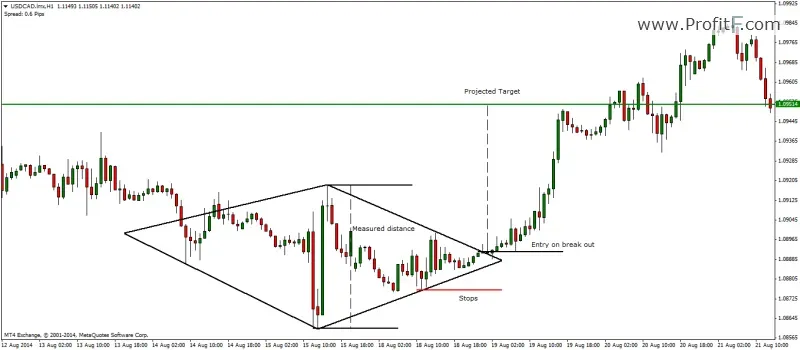
Triangle chart patterns

And speaking of triangles, these patterns are formed by two converging trend lines but unlike wedges, either the support or resistance is static. There is also a neutral variation of the crypto triangle pattern, which is symmetrical and shows no trend bias — wedges follow an upward or downward trend.
As the buyers or sellers gain more confidence in the range, they are increasingly likely to push through the support or resistance level. A possible range where the breakout can take the price is measured by applying the height of the widest part of the triangle to the breakout level. For a triangle to be considered valid, the price has to touch each of the trend lines more than twice.
Rhythmic Patterns

Some economists and traders believe there are patterns based on the rhythm with which the price moves. This is the principle behind wave, ABCD, and butterfly patterns. By noticing these trends on a crypto chart, we can anticipate where the price will end up next.
For example, the ABCD pattern consists of two equal leg-ups (the movement from A to B and C to D). A butterfly pattern aims to predict the best price to enter during a trend change: it starts with a swing, a reversal, followed by another reversal, and is expected to conclude with a breakout of a similar magnitude to the first move. If we know the first three or four points, we should easily extrapolate the final one and place an order.
Wave principles, such as Elliott waves, also follow the same logic: a price increase is always followed by a decrease, and the only difference is in the intensity of these moves. These patterns are self-repetitive on any time scale. However, there are as many criticisms of these theories as there are endorsements.
Cheat Sheet for the Crypto Patterns
Having a cheat sheet for the crypto chart patterns on hand is always useful and not really cheating like in school. Luckily for you, the ChangeHero team has already made a cheat sheet for the essential crypto chart patterns. If you want to read a thorough explanation for each pattern summarized in our trading patterns cheat sheet, read this guide!
As simple as any crypto pattern cheat sheet is, it can help you identify them on a cryptochart more quickly, letting you make use of more opportunities. Another use of a cheat sheet is for learners, so that they make the right call upon identifying crypto trading patterns they become familiar with.
How Reliable are Chart Patterns?
Opinions differ on how really helpful are chart patterns and formation trading, especially in crypto. On the one hand, there have been scientific and academic attempts to shape the practice. On the other hand, they are sometimes dismissed as pareidolia (seeing patterns where there are none) or “astrology for boys”.
Regardless of what preconceptions you might have about this, in isolation, even the most reliable patterns tell very little. Extra information provided by additional tools like MACD indicator or Exponential Moving Average (EMA) is crucial, but how to use them is outside of the scope of this guide.
Without any doubt, using chart pattern analysis is common among cryptocurrency traders. Perhaps, after years of looking for the patterns and expecting a certain behavior to follow, it has become a self-fulfilling prophecy to an extent.
Nevertheless, there have been empirical-based attempts to measure just how effective charting these patterns when trading crypto really is. One of the most effective Bitcoin and crypto chart patterns turned out to be inverse head and shoulders with an 82% validity rate. Pennants and rectangles pointed to trend continuation in 52% of the cases, making them some of the least reliable indicators.
There is always a chance that the price action will be influenced by external factors: news, updates, FUD and FOMO alike. Crypto charts with indicators and patterns work in conjunction with each other but ultimately are not ironclad rules that dictate how price moves.
Conclusion
Crypto graph analysis more often than not helps determine where the price will move next and how far it will go. Once you learn to notice these common crypto trading patterns on a chart yourself, the crypto market will seem less hectic and more manageable.
Keep an eye on ChangeHero blog for more insights from our team. To stay in the know, subscribe to ChangeHero on Telegram, X (Twitter), and Facebook.
Frequently Asked Questions
What are chart patterns in crypto?
In crypto, just like in the stock market, chart patterns are commonly observed regularities and trends that manifest in certain ways on the price charts. They are theorized to demonstrate the mass psychology of traders in a market and be the basis for forecasting the continuation of the price trajectory.
What are the basic patterns in crypto?
There are a multitude of crypto chart patterns, pointing either at a trend continuation or a reversal. They include but are not limited to channels, wedges, triangles, flags, pennants, tops, and bottoms.
Can I trade crypto using chart patterns?
Despite the crypto market generally being more volatile than the stock market or currency exchange, and despite being open 24/7, crypto chart analysis follows the same principles and structures as traditional markets. As such, patterns that originate from the stock market work just as well for crypto pattern day trading.
What is the best chart pattern for crypto?
As far as the best charts for crypto trading go, there is no single winner. The best charting strategy for crypto is to be on the lookout for multiple patterns to identify trends or their changes.
What is the most accurate crypto chart?
The best tools for crypto charts can be found on TradingView, which has a freemium subscription. The widespread popularity of this platform for traditional trading and crypto alike cements it as the best crypto chart platform for traders of all levels. Its free crypto charts with indicators are a good place to practice and start mastering trading.