When is the Next Crypto Bull Run? Signals and Preparation

Key Takeaways
- 🐂 The next crypto bull run is a 2026–2027 window, not a calendar date. Mid 2026 (Q2–Q3) if Bitcoin consolidates then breadth rotates; Late 2026 (Q4+) if macro/regulatory headwinds keep the market range-bound.
- 🐂 Mid 2026 confirmation is a breadth event, not a headline event: BTC holds a higher low (> $65K), Fear & Greed stays 65+ for 6 weeks, Altcoin Season Index >75, and ETH outperforms BTC over 30 days (rotation is the tell).
- 🐂 Late 2026 delay becomes likely if liquidity stays tight and structure churns: restrictive Fed through Q3, BTC stuck $50K–$65K for two quarters, repeated leverage flushes, regulatory overhang, and flat/down on-chain—with February 2026’s market contraction as a live example of how momentum gets postponed.
Contents
- 1. What is a Bull Run?
- 2. Historical Bull Run Patterns
- 3. Market Conditions in 2026
- 4. Market Condition Summary for Tracking
- 5. Bull Run Timing Scenarios for 2026
- 6. Indicators to Watch
- 7. Catalysts for a 2026 Bull Run
- 8. How to Prepare for a Bull Run
- 9. Main Risks to Cover in Bull Run Preparation
- 10. Conclusion
The next crypto bull run will most likely unfold across 2026–2027 as a series of probabilistic timing windows, not a single predictable date, shaped by halving-driven supply reduction, macro liquidity shifts, on-chain accumulation signals, and catalyst-driven sentiment breakouts. When is the next crypto bull run down to the date? Don’t go into this guide expecting predictions like that.
What follows is a scenario framework—mid and late 2026—paired with the exact indicators that would validate (or invalidate) each path. If you want a repeatable way to judge momentum instead of chasing narratives, this guide is built for you.
What is a Bull Run?
First things first: let’s define the terms and concepts that the guide operates with. A bull run is a sustained price advance in Bitcoin and major altcoins lasting 6–18 months, typically driven by positive liquidity conditions and institutional adoption momentum. Liquidity conditions mean the availability of capital flowing into risk assets, proxied by factors like the Federal Reserve balance sheet size, stablecoin supply, and global liquidity expansion policy stance.

In other words, a bull run is a period when certain market conditions persist. As is typical for periodic events, they come in phases. First, a bull run is preceded by accumulation — a range-bound consolidation phase where long-term holders increase positions; flat prices with rising wallet balances and declining exchange reserves are a good sign of this phase. Secondly, it is followed by distribution, late-cycle selling by smart money into retail demand; characterized by price stagnation despite positive news and rising leverage. Between the bull runs, peak-to-trough drawdown is a maximum percentage decline from a cycle high to the subsequent low that is used to gauge bear-market severity.
Break-It Scenario
Five concrete triggers would invalidate our 2026–2027 bull run framework:
- Persistent global liquidity contraction — If the Federal Reserve and major central banks maintain restrictive policy into late 2026 despite recession risks, risk assets including Bitcoin face sustained headwinds and rising bearish pressure.
- Stablecoin supply decline exceeding 15% — A prolonged drop in USDT and USDC market cap signals liquidity exit from crypto markets and reduced buying power.
- Sustained risk-off USD strength — Dollar index above 110 for consecutive quarters typically correlates with capital flight from emerging markets and speculative assets.
- Major regulatory enforcement shock — Coordinated crackdowns on exchanges, stablecoins, or DeFi protocols by U.S., EU, or Asian regulators would fragment liquidity and dampen institutional adoption.
- Cascading leverage unwind — A repeat of 2022-style liquidation spirals driven by overleveraged positions in derivatives markets, measurable through funding rate collapses and open interest crashes.
Another heads-up before we proceed: the intended audience for this guide is investors and traders operating on 6–18 month time horizons who want probabilistic frameworks rather than certainty. It does not provide personalized financial advice, guaranteed peak dates, or specific buy/sell calls.
Historical Bull Run Patterns
Historical Bitcoin-led cycles give us a useful pattern library for how crypto markets tend to build, peak, and reset. Naturally, this is context, not a blueprint. Timing can compress or stretch depending on liquidity regimes, regulation, and market structure.
Bitcoin Halving Cycles
Miner reward halving, Bitcoin’s programmed issuance reduction creates a predictable supply shock that has historically preceded major bull runs through a mechanism chain. The most recent example is the April 2024 halving, which reduced the block subsidy from 6.25 BTC to 3.125 BTC per block.
From there, miner economics adjust. Miners near break-even either improve efficiency or reduce sell pressure by holding coins instead of liquidating immediately. As that sell-pressure dynamic shifts, price becomes more sensitive to marginal demand—and that’s where reflexivity kicks in. Even modest inflows can move the price harder when fewer coins are being sold to absorb them, which can attract more speculative capital, reduce exchange supply further, and help the uptrend sustain itself.
Despite cryptocurrencies other than Bitcoin replicating this issuance schedule (e.g. Litecoin), this effect has historically proven to be Bitcoin-specific. Still, previous Bitcoin-led bull markets have triggered liquidity and attention spillovers into the broader crypto ecosystem. For context, the next Bitcoin halving is currently expected around April 2028, positioning 2026 as a mid-cycle phase following the 2024 halving.
Post-Halving Timing Windows

BTC price chart with bull run performance measured. Note that the range increases on the X axis (time) vs. decreases on the Y axis (price performance).
Across these cycles, three post-halving phases show up frequently:
- 0–3 months: Digestion — Sideways to slightly positive action as the market absorbs the halving and “buy-the-rumor” traders take profits.
- 3–12 months: Trend Formation — Sustained momentum starts to build, often breaking prior highs as new capital arrives. Leverage increases gradually, and altcoin strength improves selectively.
- 12–18 months: Late-Cycle Acceleration — The explosive, highest-risk window. Leverage and open interest can hit historic cycle peak levels, and speculative sectors often surge as retail participation peaks.
Once again, this is grounded in retrospective analysis, not fundamental rules. Trend can fail to form, and timing can compress or extend. External factors have more influence on this pattern than past performance.
Peak-to-Trough Drawdowns
A peak-to-trough drawdown is not the same as an intracycle correction: a pullback (often 10–30%) within an ongoing bull market. The former can be analyzed only in hindsight, when the bull run is over until the next cycle. Relevantly, bear-market duration is the time from cycle top to the next sustained uptrend, often 12–18 months or longer.
| Cycle (Year Range) | Approx. Peak Month | Approx. Trough Month | Approx. Drawdown % | Time-to-Trough (Months) | Key Structural Driver |
|---|---|---|---|---|---|
| 2013–2015 | Nov 2013 | Jan 2015 | ~85% | 14 | Mt. Gox collapse, regulatory uncertainty |
| 2017–2018 | Dec 2017 | Dec 2018 | ~83% | 12 | ICO bubble burst, retail exhaustion |
| 2021–2022 | Nov 2021 | Nov 2022 | ~77% | 12 | Fed tightening cycle, credit contagion (FTX) |
Market Conditions in 2026
For Bitcoin and Ethereum, the 2026 landscape so far can be described as post-accumulation where liquidity transmission channels dictate price momentum more than headline narratives, volatility regimes shift with leverage cycles rather than fundamental catalysts, and the interplay between macro liquidity tightening and crypto-native capital formation determines whether the market graduates from range-bound consolidation into sustained trend expansion.
Late 2025 Accumulation Phase
The late 2025 accumulation phase left behind measurable fingerprints that carry into 2026:
- Long-term holder accumulation trend — When 155+ day holders increase their aggregate balance, it points to conviction accumulation, reducing float once liquidity improves.
- Exchange balance direction — Declining exchange balances, especially when prices are stable-to-rising, usually implies reduced immediate sell pressure.
- Spot volume versus derivatives dominance — Accumulation phases often show spot volume holding up versus perpetuals, which helps distinguish base-building from froth, including the February 2026 setback documented in Binance Research's monthly insights.
- Range-bound price structure — Multi-month channels (for example, $85,000–$105,000) often create “coil” behavior that can break hard once liquidity confirms.
However, false positives are equally as real: dead-cat accumulation during macro tightening can look like scarcity when it’s actually evaporating participation. Distribution disguises itself as consolidation when large holders exit into stable price action. To separate the real from the fake, cross-reference stablecoin supply growth. Falling exchange balances + flat/contracting stablecoin supply suggests capital leaving crypto, not rotating. Also, monitor perpetual futures funding rates. Persistent negative funding during “accumulation” can indicate genuine demand absorption; neutral-to-positive funding can signal weak conviction or distribution.
Liquidity Conditions
Liquidity in 2026 has two lenses, and you need both: macro liquidity and crypto-native liquidity.

Photo by Daniele Levis Pelusi on Unsplash
Macro liquidity is driven by policy and credit conditions:
- Global liquidity expansion or contraction: Central bank balance sheet trends (Federal Reserve, ECB, PBOC).
- Interest rate trajectory: Rates affect the opportunity cost of holding non-yielding assets like Bitcoin.
- Cross-asset correlation behavior: Correlation to Nasdaq/S&P 500 near 0.6–0.8 suggests macro dominance; decoupling suggests crypto-native drivers matter more.
Crypto-native liquidity reflects capital already inside the ecosystem:
- Stablecoin supply growth: A primary “dry powder” proxy.
- Spot market depth: Order book depth and spreads on Binance, Coinbase, Kraken.
- Bitcoin ETF flow persistence: Creation/redemption data as direct institutional demand measurement.
According to December 2025 reporting on Bitcoin's trajectory, Bitcoin ETF inflows surged past $35 billion within the first year of availability, making ETF flows a concrete proxy for crypto-native liquidity. In 2026, the key nuance is divergence: ETF flows can be strong while stablecoin supply is flat, creating a split where institutional liquidity and on-chain liquidity run on different clocks—especially with evolving stablecoin infrastructure.
Liquidity and capital travel to and in crypto through channels:
Federal Reserve policy → interest rates → risk-on rotation: You often see correlated crypto rallies after policy shifts, typically with a 2–7 day lag. Observable metric: Bitcoin’s percentage change in the 14 days following FOMC meetings.
Stablecoin issuance/redemptions → exchange/DEX liquidity: New USDT/USDC can quickly become deployable buying power. Observable metric: Weekly net change in stablecoin market cap and exchange-held stablecoin balances, a core stablecoin rail for routing dollar liquidity.
Bitcoin ETF creations/redemptions → spot demand: ETF creation requires spot buying; redemptions can increase circulating supply. Observable metric: Daily net ETF flows tracked by Coinglass and market data providers.
Volatility Regimes
Realized volatility measures the actual magnitude of price changes over a historical lookback period, calculated as the standard deviation of logarithmic returns, typically expressed as an annualized percentage. Implied volatility represents the market's forward-looking expectation of future volatility, derived from options pricing via the Black-Scholes model, reflecting what traders are willing to pay for protection or speculation. Funding-rate-driven volatility emerges from perpetual futures markets where periodic payments between longs and shorts create reflexive feedback loops—positive funding (longs paying shorts) during rallies can suppress speculative excess, while negative funding (shorts paying longs) during dips can accelerate short squeezes, generating volatility independent of fundamental factors. These three volatility types interact but measure fundamentally different phenomena: realized looks backward, implied looks forward, and funding-rate-driven volatility responds to leverage positioning in real-time.
Volatility in 2026 tends to cycle through compression → expansion → trend volatility:
- Compression regime: Tight ranges, falling realized volatility, funding near zero; implied volatility often bottoms before realized volatility expands.
- Expansion regime: Realized volatility accelerates, leverage builds quickly, funding rates spike; often the most dangerous for false breakouts.
- Trend volatility regime: Sustained directional movement with elevated but stable volatility; funding normalizes before trend exhaustion shows up in price.
Market Condition Summary for Tracking
| Condition | What Improving Looks Like | What Worsening Looks Like | Why It Matters for 2026 |
| Macro Liquidity | Global central bank balance sheets expanding; Fed rate cuts or extended pause; falling yields | Quantitative Tightening acceleration; rate hikes resume; credit spreads widening | Sets the ceiling for risk-asset valuations; improving conditions enable earlier bull run timing |
| Crypto-Native Liquidity | Stablecoin supply +5-10% monthly; Bitcoin ETF inflows >$500M weekly; exchange depth thickening | Stablecoin supply flat or contracting; ETF outflows; bid-ask spreads widening | Determines whether institutional and retail capital can sustain rallies; divergence from macro liquidity creates timing uncertainty |
| Volatility Regime | Compression → expansion with positive funding; implied vol rising ahead of realized | Expansion without follow-through; funding rates extreme (>0.1% or <-0.1%); failed breakouts | Regime transitions confirm or invalidate accumulation phase success; expansion without trend volatility signals false breakout risk |
| Long-Term Holder Accumulation | LTH supply increasing; exchange balances declining; spot volume stable or rising | LTH supply flat; exchange inflows accelerating; spot volume collapsing | LTH accumulation absorbs supply and reduces downside risk; failure to accumulate extends base-building phase |
| Sentiment | Fear & Greed Index 40-55; social volume declining; search interest normalizing | Extreme fear (<20) persisting; capitulation narratives dominating; retail disengagement | Neutral sentiment offers asymmetric entry opportunities; extreme fear can either mark bottoms or signal deeper structural issues requiring validation |
Bull Run Timing Scenarios for 2026
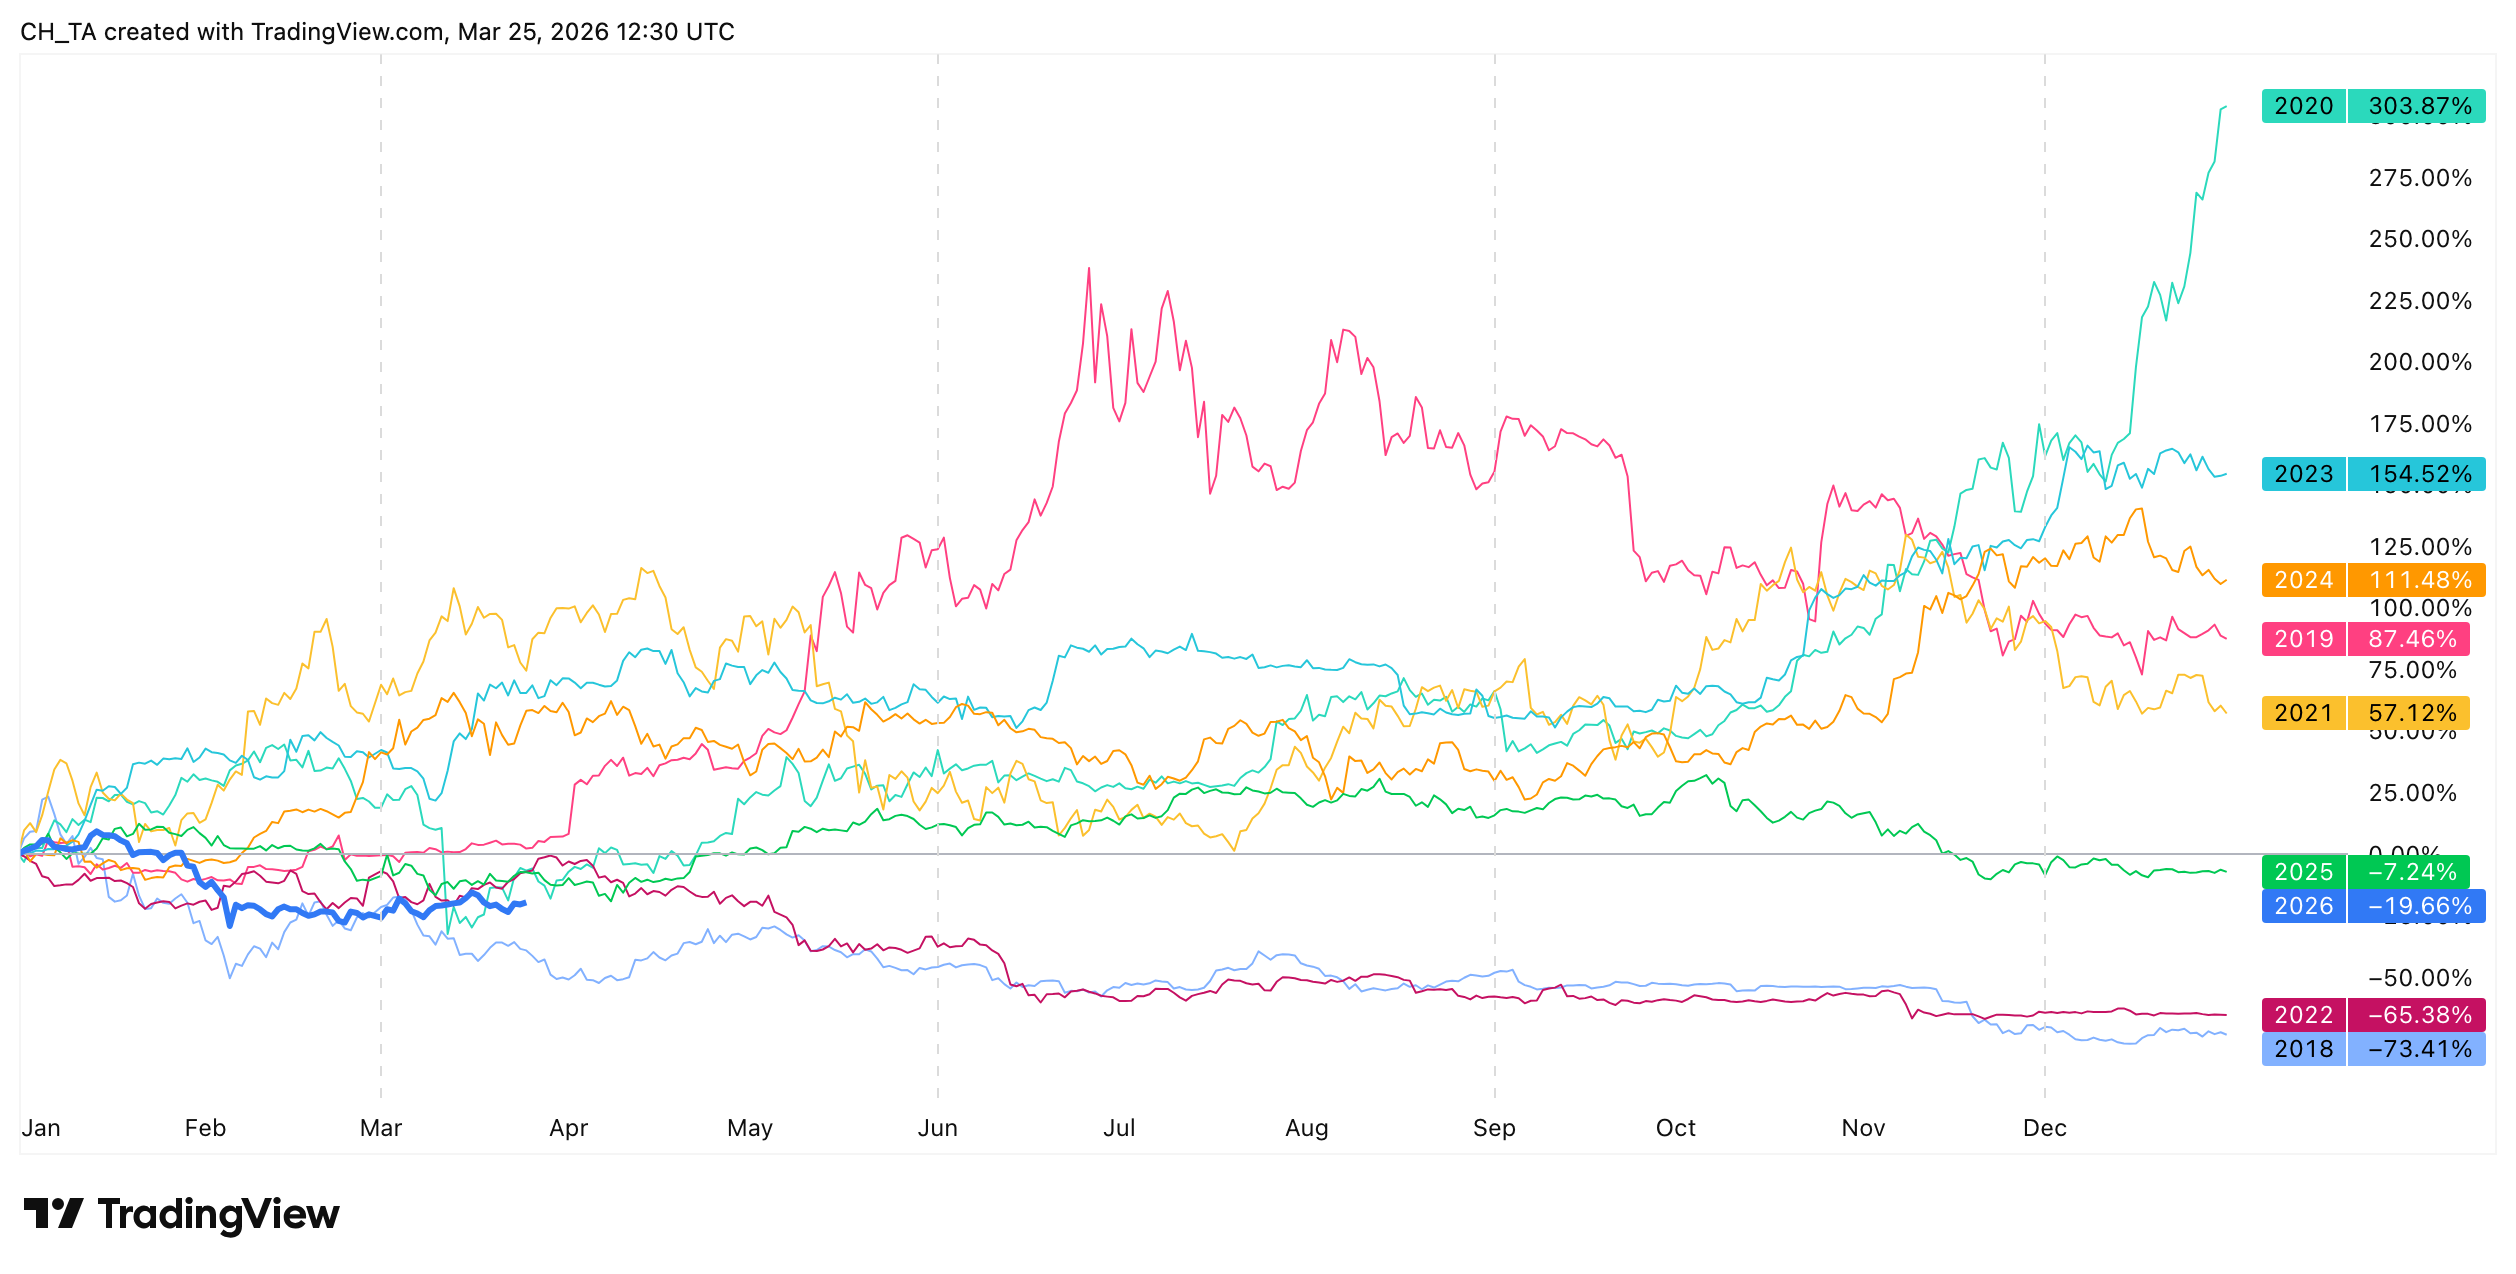
Bitcoin performance year-by-year 2018–2026. Source: TradingView
Three distinct timing paths for the 2026 bull run depend on macro liquidity conditions, institutional demand acceleration, and market breadth expansion. The scenarios below are built to be used like a checklist: when conditions line up, you increase probability; when invalidation signals show up, you reduce exposure and reassess.
The Mid-2026 scenario covers Q2–Q3 (April–September), and Late 2026 covers Q4+ (October onward or into 2027). The next Bitcoin halving is expected around April 2028, so 2026 timing is driven more by liquidity cycles and institutional adoption than by an imminent halving.
By March 2026, even though Q2 is still ahead, the early 2026 bull run scenario is the least feasible. Although timing allows for it, the necessary conditions have not materialized. However, scenarios that expect a Bitcoin bull run later in the year are still worth highlighting.
Mid-2026 Scenario
Base-case thesis: The bull market materializes in Q2–Q3 2026 after early Bitcoin-led moves consolidate, requiring Altcoin Season breadth expansion and sustained risk-on sentiment across crypto and traditional markets.
Conditions:
- Bitcoin establishes a new higher low above $65,000 after an initial Q1 2026 rally attempt stalls.
- Fear & Greed Index maintains “Greed” territory (65+) for six consecutive weeks without collapsing back into “Neutral,” signaling sustained optimism and rising bull run anticipation.
- CMC Altcoin Season Index crosses above 75, confirming broad rotation beyond Bitcoin.
- Institutional adoption metrics accelerate with at least two major announcements per month, reinforcing BTC’s role as a treasury reserve asset.
- Equity markets make new highs, reducing correlation regimes that suppress crypto rallies.
Earliest confirmation signal: Ethereum outperforms Bitcoin on a 30-day basis for the first time in the cycle, signaling a clean bullish crossover in relative strength.
Lagging confirmation signal: Mid-cap altcoins (ranked 20–50) achieve 50%+ gains from Q1 lows.
Invalidation / delay signals:
- Bitcoin fails to hold $60,000 support during Q2 retests.
- CMC Altcoin Season Index remains below 50 through June 2026.
- Geopolitical shocks or unexpected regulatory crackdowns disrupt stablecoin supply or force exchange deleveraging events.
Market structure expectations:
- Volatility regime: Moderate grind-higher (8–12% monthly).
- Breadth character: Rotation-led leadership rather than single-asset dominance.
- Movement pattern: “Grind higher” with multiple 10–15% pullbacks.
In case you observe this scenario becoming more and more likely, diversify into high-conviction altcoins once Ethereum confirms outperformance and CMC Altcoin Season Index exceeds 75. Set trailing stops at 20% below local highs.
Late 2026 Scenario
Base-case thesis: The bull run delays until Q4 2026 or early 2027 as macro headwinds, regulatory uncertainty, or persistent consolidation phase keeps the market range-bound longer than expected.
Conditions:
- The Federal Reserve maintains restrictive monetary policy through Q3 2026.
- Bitcoin trades in a defined $50,000–$65,000 range for two consecutive quarters.
- Derivatives positioning shows repeated leverage flush events (funding rates oscillating between -0.02% and +0.01%).
- Regulatory developments (U.S. SEC actions, global stablecoin legislation) delay institutional deployment.
- On-chain metrics remain flat or decline year-over-year.
According to Binance Research, the cryptocurrency market experienced a significant contraction in February 2026, with total market capitalization declining 10.8% and trading volumes dropping 28% month-over-month, reflecting persistent risk-off sentiment and consolidation pressures that support a delayed bull case scenario.

Earliest confirmation signal: Bitcoin reclaims $70,000 with weekly closes in Q4 2026, coinciding with Federal Reserve policy pivot announcements or major institutional adoption milestones—a credible milestone event.
Lagging confirmation signal: Stablecoin supply rebounds above previous cycle highs ($150 billion+) after months of stagnation.
Invalidation / delay signals:
- Bitcoin breaks below $48,000 support.
- Stablecoin supply contracts by 10%+ from Q1 2026 levels.
- Macro conditions worsen into a multi-quarter risk-off regime.
Market structure expectations:
- Volatility regime: “Compression then expansion.”
- Breadth character: Bitcoin-concentrated breakout first, altcoin rotation delayed 2–3 months.
- Movement pattern: “Delayed impulse.”
In this case, keep position sizes smaller during consolidation; scale in only when higher lows above $65,000 are clear. Monitor liquidity and derivatives metrics weekly.
Indicators to Watch
“When” can imply not just time and date but also the convergence of necessary conditions. The signs to monitor are not mysterious and were already mentioned briefly. To tie it all together, let’s go over each one.
Additionally, the cadence of monitoring is equally as important. These indicators are best reviewed weekly, while spot-checks during high-volatility windows are a daily deal, and macro shifts occur most noticeably on the monthly scale. Signals are at most effective as a cluster confirmation system: look for 3 of 6 indicators to align before calling a regime change.
On-Chain Activity
Network demand through wallet behavior, throughput, and holder positioning, including shifts in crypto transaction counts and fee-paying usage. Rising activity signals genuine engagement and capital deployment.
Bullish tells:
- Active addresses trending upward over 30–60 days
- Transaction count and fees rising together
- Exchange netflows turning negative with declining exchange balance
- Long-term holder cohorts accumulating supply
- Realized profit/loss neutral or slightly positive
Bearish/false-positive tells:
- Activity spikes driven by memecoin mania or airdrop farming
- High fees without corresponding price appreciation
- Exchange balances rising
- Realized profit ratio spiking above 0.75
Where to track: Glassnode, CryptoQuant, Coinbase Analytics, Etherscan, Blockchain.com.
Market Liquidity
Bullish tells:
- Spot volume rising with improving depth
- Spreads narrowing on Binance and Coinbase
- Volatility compression followed by a volume-confirmed breakout
- Macro proxies expanding after contraction
Bearish/false-positive tells:
- Panic volume spikes with thin order books
- Macro tightening overriding crypto-native signals
Signal hierarchy: Macro first, then confirm crypto-native liquidity. In this article, macro liquidity means broader financial system capital availability driven by policy, credit, and money supply.
Derivatives Positioning
While it is not the most obvious metric at the first glance, leverage, crowding, and reflexive risk provide valuable insight into the state of the market.
Bullish tells:
- Funding positive but below 0.1%
- Open interest rising with price
- Long/short ratio balanced or slightly long-biased
- Leverage flush followed by stabilization
Bearish/false-positive tells:
- Funding above 0.2%–0.3% persistently
- Open interest surges while price stalls
- Long/short ratio above 3:1
- High funding without price progress
Where to track: Coinglass, Binance/Bybit dashboards, CoinGlass Liquidations Map.
Stablecoin Supply

Similarly discussed above, for knowledge on dry powder and capital positioning, stablecoin metrics are the most effective tell.
Bullish tells:
- Supply rising over 30–60 days
- Exchange stablecoin balances increasing
- Stablecoin transfer activity surging
- BTC/ETH exchange balances declining as stablecoins deploy
Bearish/false-positive tells:
- Supply rising but spot volume stagnant
- Stablecoins to exchanges without buy pressure
- Macro risk-off flows into stablecoins without follow-through
Where to track: CoinGecko, CoinMarketCap, Glassnode, CryptoQuant, Curve, Uniswap.
Bitcoin Dominance
Put simply, BTC’s share of total crypto market cap. For more depth of coverage, refer to our guide to Bitcoin dominance.
Rising dominance can be a bullish signal early-cycle (flight to quality). Mid-cycle, you’d want to see rotation into alts, and falling BTC.D is your cue.
Altcoin Breadth
What separates a bull run in the crypto market from an occasional more localized surge is the breadth of the trend. Bitcoin’s rising wave lifts all alts along, not a separate few.
Bullish tells:
- 60%+ of top 100 above a major moving average
- Advancers beating decliners for 3–5 weeks
- CMC Altcoin Season Index above 75
- Sector-led strength expanding into broader participation
Bearish/false-positive tells:
- Less than 40% above key moving averages
- Breadth confined to one narrative cohort
- CMC Altcoin Season Index below 25
In any case, Bitcoin dominance trend and altcoin breadth must agree before calling it “Altcoin Season.” If dominance drops but only a few tokens rally, it’s rotation, not a season.
Catalysts for a 2026 Bull Run
Four catalysts tend to matter most in 2026: institutional ETF flows, regulatory clarity, monetary policy shifts, and technology adoption. Likewise, each one can push the market, but sustained upside usually requires alignment across more than one.
Institutional ETF Flows
Mechanism: Spot Bitcoin ETFs convert inflows into spot demand through creations/redemptions. Unlike futures products, net inflows require actual Bitcoin acquisition, tightening supply.
What to measure: Daily/weekly net inflows, days-with-positive-flows streaks, AUM growth. Compare inflows to spot volume and derivatives open interest to judge whether demand is real or leverage-driven.
Falsifiers: If inflows go flat/negative while price rises, the rally is likely running on leverage and derivatives gamma. Concentration risk also matters if one issuer dominates flows.
Regulatory Clarity
Three branches matter:
- Exchanges and broker-dealers: Licensing clarity tightens spreads and improves depth.
- Token classification frameworks: Reduces delisting risk premiums, especially for DeFi and Layer-2s.
- Stablecoin and custody standardization: Enables institutional-grade rails and faster stablecoin supply growth.
Watch items: Guidance publications, licensing approvals, and U.S. market-structure debates including the U.S. CLARITY Act.
Monetary Policy Shifts
Crypto responds to policy through dollar liquidity conditions (stablecoin supply growth as the key on-ramp) and duration and risk-asset correlations (why rates fall matters as much as the direction).
On the other hand, if rates fall because recession risk rises, crypto can see false starts—initial rallies that fail before a later recovery leg.
Technology Adoption
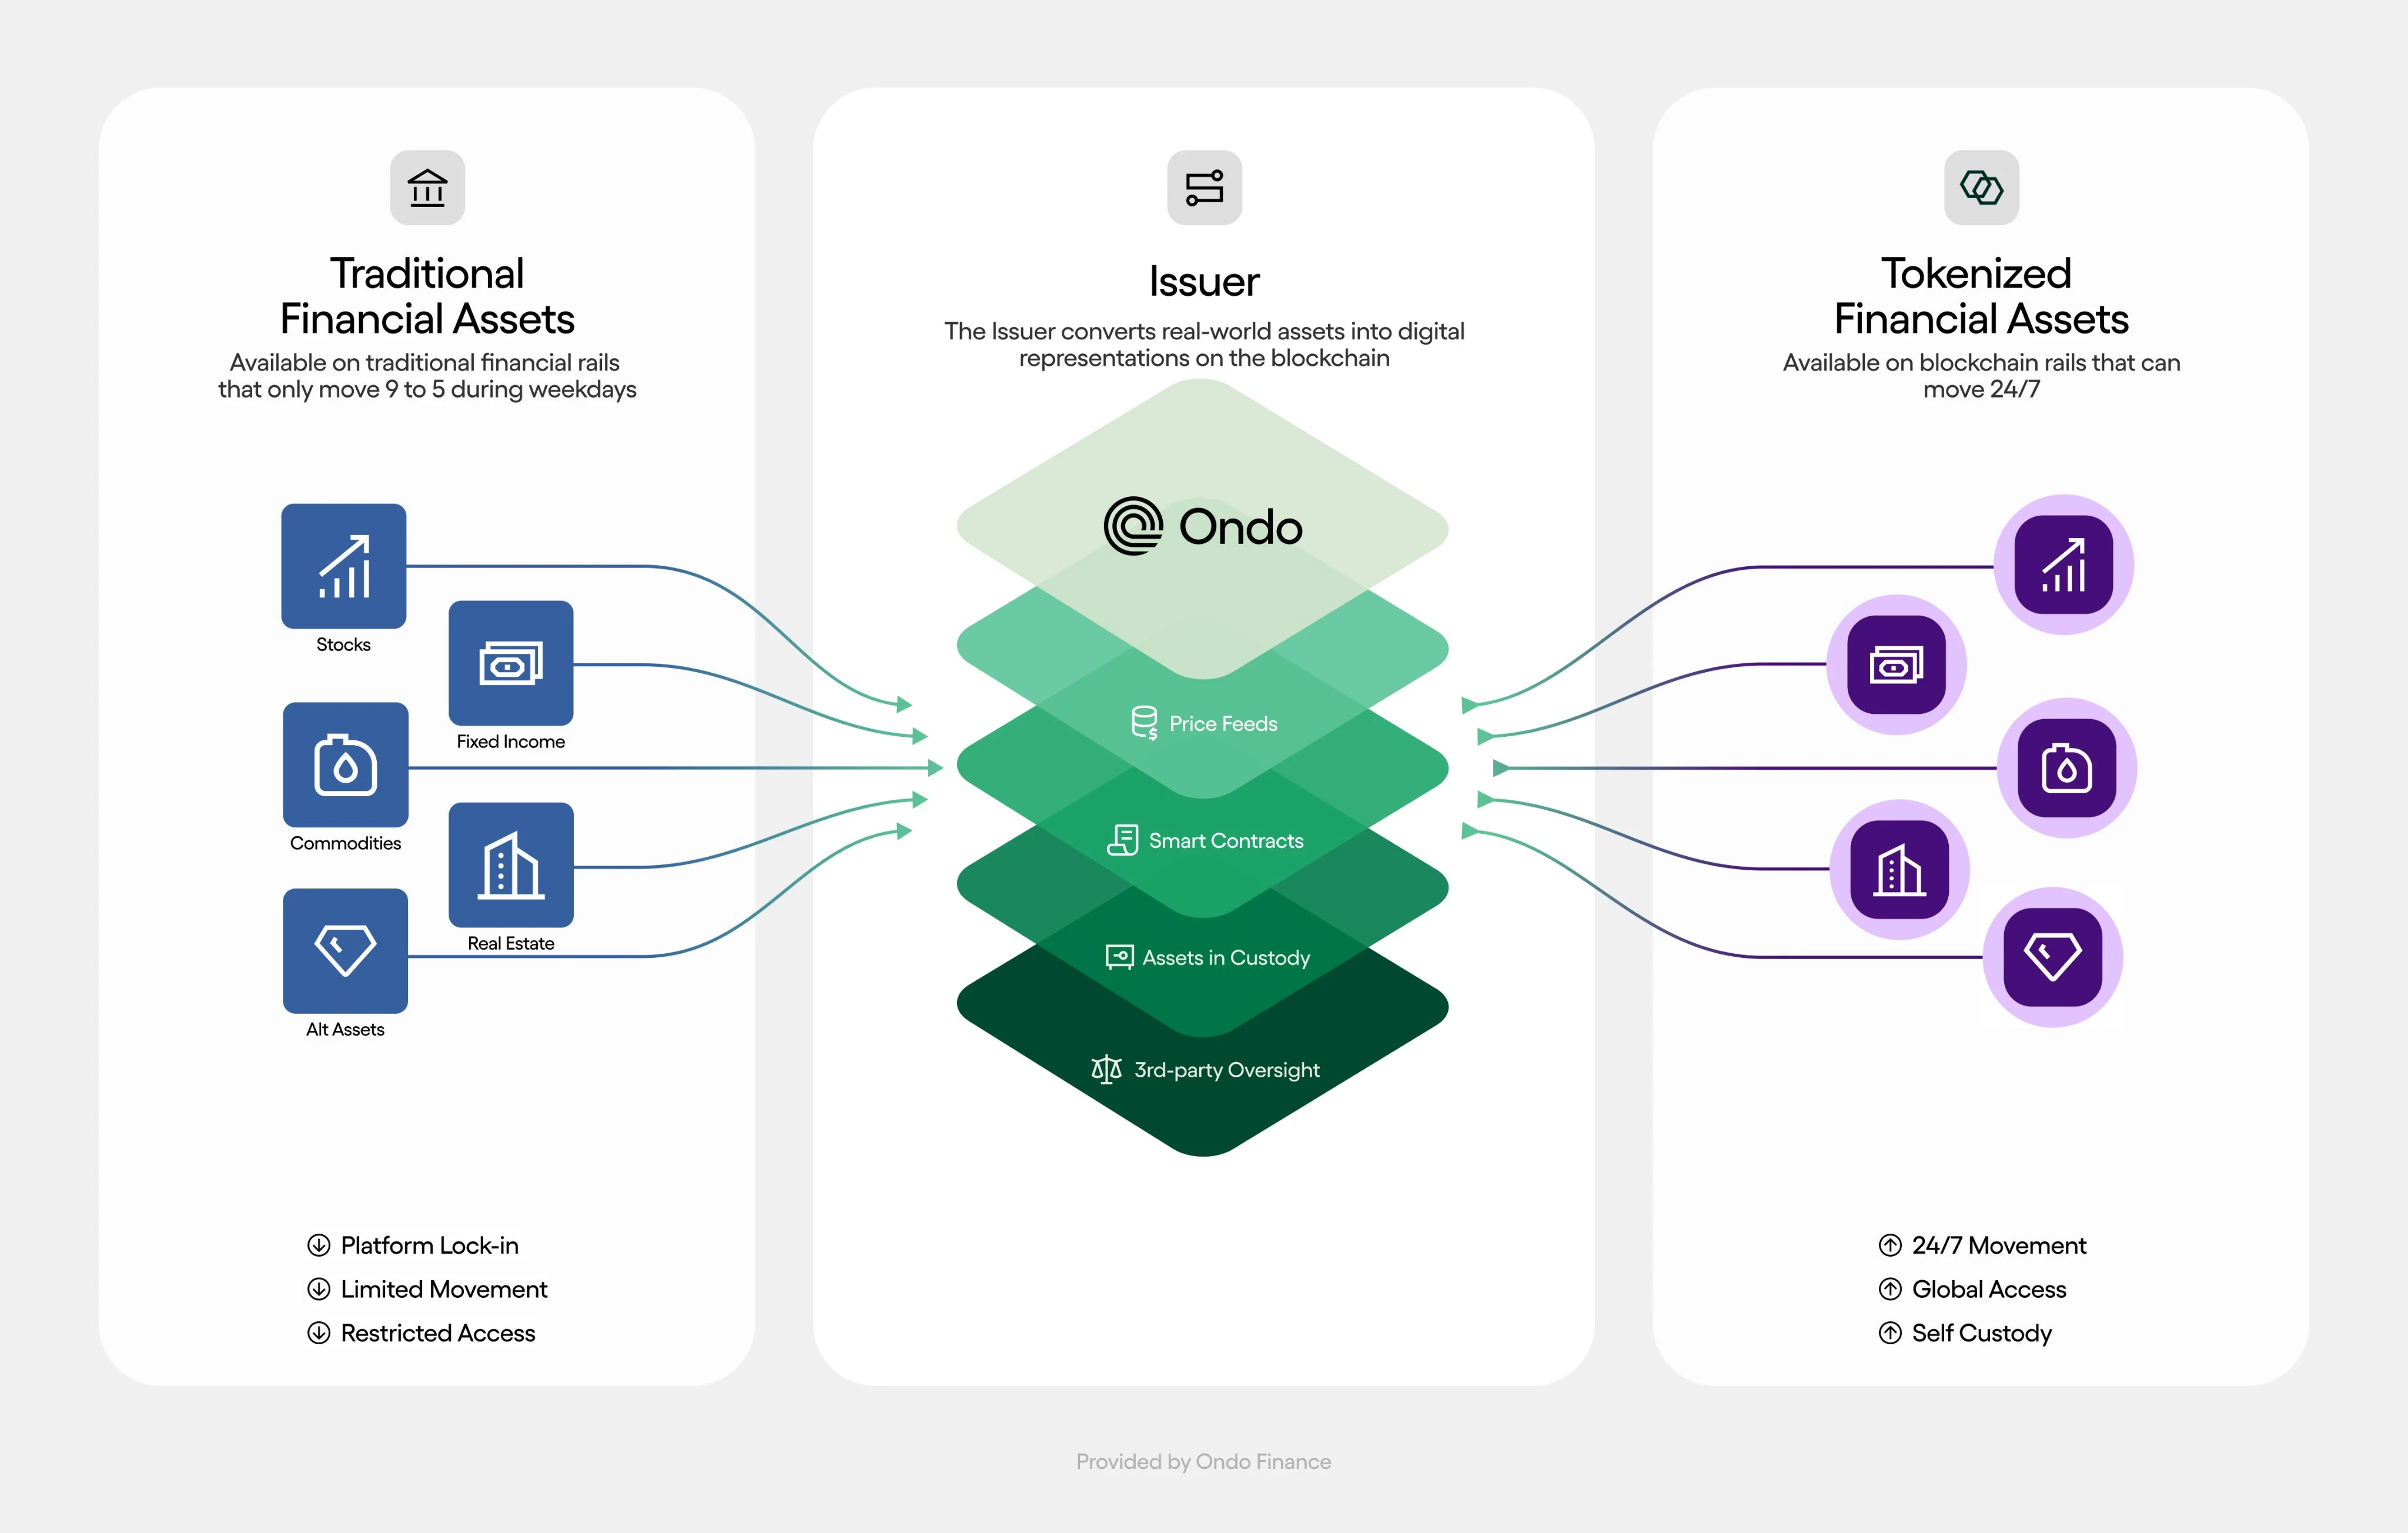
How Tokenization Works (with Ondo Finance as example). Source: STRENGTHENING AMERICAN LEADERSHIP IN DIGITAL FINANCIAL TECHNOLOGY, Executive Order 14178 of January 23, 2025
- Scaling and fees: Lower fees expand real usage; this is central to scaling Ethereum.
- Consumer distribution: Better onboarding and sustained UI/UX development drives retention.
- New primitives: ZK, modular stacks, and restaking behave increasingly like a modular DeFi primitive.
- Real-world utility: Stablecoin payment rails and tokenized asset growth create non-speculative demand.
How to Prepare for a Bull Run
The real point of the question “when is the next crypto bull run” is not even the timing. Traders and investors ask themselves that to properly prepare and brace for the rising wave, ideally, making some profits in the process.
Execution discipline is what turns a “correct thesis” into a survivable outcome. Even the best timing scenario still includes sharp corrections and fast leverage flushes, so you want your plan written before volatility spikes and market cooling reappears.
Before you dive into things pertaining to your portfolio, make sure you are up to speed on custody and operational security. Our guides on how to secure your crypto wallet and how to back up a recovery phrase properly are a good starting point.
Portfolio Construction
Picking one potential winner even in the best possible conditions is not the recipe for success; in fact, going all in on one asset more often is outperformed by the diversified core-satellite portfolios. This approach both captures the upside in riskier assets and dampens the blow in pullbacks and corrections.
First off, compose the core for capital preservation with beta exposure: in crypto portfolios, that would be BTC and ETH. Aim to hold this position for 12–24 months minimum and rebalance either when combined BTC/ETH drifts below 50% (conservative) or above 70% (aggressive). Avoid over-concentration creep into alts during fast rotations.
Next are the satellites: make space in the portfolio not just for any altcoin but pick thematic alts (Layer-2s, DeFi, AI-crypto) in case of sector outperformance. Even the best altcoins for bull run are also to be treated differently from the core: the typical holding period is shorter at 6–12 months, and rebalancing is quicker at >15% of the whole (or when the investment thesis seriously deteriorates).
Save the best for last: those high-risk bets in microcaps, new launches, and leverage plays. Due to the size (under 5%) of this sleeve, the holding period rarely exceeds 1–3 months. Managing is not too hard: rebalance when the whole sleeve exceeds 20% or any single position is more than 5% to not let any winner dominate your portfolio.
Position Sizing
| Input Parameter | Definition | Example Value |
|---|---|---|
| Account Size | Total capital allocated to active trading/speculation (excludes long-term hold stack) | $50,000 |
| Max Risk Per Trade | Maximum acceptable loss as % of account if stop-loss is hit | 2% |
| Stop Distance | Distance from entry to invalidation level, expressed as % | 10% |
| Position Size Formula | (Account Size × Max Risk Per Trade) ÷ Stop Distance | ($50,000 × 0.02) ÷ 0.10 = $10,000 |
Limit total at-risk capital across all open positions to 8–10% of account size to reduce aggregate financial risk during sector-wide flushes.
Profit-Taking Framework
Like with portfolio building, profit-taking is also not “selling the top” and calling it a day. Here is a more systematic approach that can ensure you exit smoothly and capture some upside in case the rally goes on.
- Tranche 1 (30%): 2x entry or position >10% of portfolio → sell 30%, stop to breakeven.
- Tranche 2 (40%): 3x entry, RSI >80, or funding >+0.1% sustained → sell 40%, trail remaining 20% below price.
- Tranche 3 (final 30%): trailing stop hit, thesis invalidated, or 5x entry → exit and rebalance into Core.
If BTC and ETH funding both exceed +0.05% daily average for 10 consecutive days, reduce portfolio exposure by 25% (High-Risk Sleeve first).
Main Risks to Cover in Bull Run Preparation
Some key considerations for preparing to ride the wave deserve a specific mention. Bull runs reward preparation, and preparation means knowing what breaks your plan.
Market Corrections
A normal bull pullback (15–25% with funding normalization) is not the same as a trend break (closing below a prior higher low with breadth deterioration).
- If the higher low holds and funding resets below +0.01%, reduce leverage but keep core.
- If price closes below that level on rising volume, rotate into Bitcoin or stablecoins.
- If breadth collapses (fewer than 30% of top-50 holding 50-day MAs), hedge or move to cash.
- Add only if the dip comes on declining volume, neutral funding, and elevated on-chain activity.
February 2026 is a clean example of downside inside a broader framework: recovery confirmation would have required spot bid liquidity returning within 72 hours, fast funding compression without another cascade, and Ethereum usage rebounding alongside DEX volumes.
Leverage Unwinds
When keeping an eye on derivatives markets, watch for open interest rising while price stalls; funding staying above +0.03% for 48+ hours; and basis compression below 2% annualized, with or without dense liquidation clusters near price.
More related signals to stay aware of are stablecoin outflows from exchanges, spreads widening in liquid hours, and cross-exchange price gaps, showing either weakening liquidity or capital migration.
Whether the signals flash or not, map it to controls: 2% max risk per leveraged position, keep total leverage below 2x, avoid stacking correlated longs, and define invalidation points above liquidation price.
Macroeconomic Factors: Regulations and Recession
Regulatory events can come in different forms and lead to various effects. Enforcement actions tend to create fast volatility. Market-structure changes cause sector repricing over weeks. Stablecoin or banking-rail constraints can even lead to acute liquidity freezes.
Even beneficial clarity can cause short-term “sell-the-news” pullbacks, while compliant assets reprice up and non-compliant assets bleed.
If recession fears materialize into actual economic backdrop, track metrics such as Central bank stance, DXY, credit spreads proxy, VIX, real yields, and global liquidity proxy (or find a reputable source that does).
In case a recession hits mid-cycle, bull timing can compress and leadership often concentrates back into Bitcoin.
Conclusion
No matter how you approach the question when the next bull market in crypto is, the answer that is better than a blind guess is probabilistic, not deterministic. Although historic timing suggests that a bull run should have happened in 2025, if it hadn’t already, the backdrop was drastically different this time around. Operating on the assumption that what we have seen is a prolonged accumulation rather than an acceleration and cooldown, mid- to late 2026 remain feasible time windows but only when the conditions are met.
How do you feel about our analysis? Let us know in the comments on ChangeHero blog or social media: Twitter, Facebook, and Telegram.
Frequently Asked Questions
When is the next major crypto bull run expected to start?
The next sustained bull market is most likely to materialize between early 2026 and mid-2026, contingent on three confirmation signals converging: stablecoin supply expansion exceeding $150 billion net issuance, sustained Bitcoin ETF inflows above $500 million weekly for eight consecutive weeks, and altcoin breadth expansion with at least 40% of top-100 tokens outperforming Bitcoin on a 30-day basis.
What triggers a new crypto bull market?
Bull markets emerge when three categories align: macro liquidity regime shifts, structural crypto flows, and internal market structure resets.
Will the 2024 Bitcoin halving affect the 2026 bull run?
Yes, the April 2024 Bitcoin halving—which reduced the block subsidy from 6.25 BTC to 3.125 BTC—continues to exert delayed reflexive effects into 2026 through a four-step causal chain: the issuance shock reduces new supply entering circulation, miner economics shift toward accumulation or reduced sell pressure, this supply constraint triggers narrative-driven positioning by institutional and retail players, and finally, the lagged liquidity response amplifies price momentum as capital chases scarce assets.
What indicators historically signal the start of a bull run?
Historically, confirmations require confluence across four groups: on-chain activity (stablecoin growth + network activity rising), liquidity expansion (Fed balance sheet/M2, real rates), derivatives normalization (funding normalization + OI aligned with price and spot), and market structure breadth (dominance/breadth rotation).
Which sectors tend to lead early in a bull run?
Early leadership often follows: Bitcoin first, then infrastructure (Layer-1s, scaling, DeFi), and application layers later—though narrative velocity can compress the sequence.
Disclaimer
This article is not a piece of financial or investment advice. When dealing with cryptocurrencies, remember that they are extremely volatile and thus, a high-risk investment. Always make sure to stay informed and be aware of those risks. Consider investing in cryptocurrencies only after careful consideration and analysis of your own research and at your own risk.