Bitcoin Dominance: Complete Guide to Understanding Crypto Market Share


Key Takeaways
- 🔋 Bitcoin dominance is the percentage of the total crypto market cap represented by Bitcoin alone;
- 🔋 The formula is simple: Bitcoin market cap divided by total crypto market cap, multiplied by 100;
- 🔋 Rising BTC.D often signals capital concentrating into Bitcoin, while falling BTC.D can signal broader participation across altcoins;
- 🔋 Dominance is a ratio, not a standalone market sentiment indicator. It must be read alongside BTC price, total crypto market cap, stablecoin dominance, and major altcoin dominance (the OTHERS indicator);
- 🔋 Data source consistency matters because different platforms calculate total crypto market cap from different asset universes.
Disclaimer
Bitcoin dominance is a market analysis metric, not investment advice. BTC.D can help contextualize capital rotation and market structure, but it does not predict price direction by itself. Data providers may calculate dominance differently depending on index composition, circulating supply methodology, and timestamping. Readers should cross-check values across their chosen charting platform and keep the same source throughout their analysis.
Contents
- 1. Bitcoin Dominance Definition and Formula
- 2. Market Signals From Bitcoin Dominance
- 3. Bitcoin Dominance Across Market Cycles
- 4. Bitcoin Dominance Charts and Indicator Setups
- 5. Stablecoin Dominance and Liquidity Rotation
- 6. OTHERS Dominance and Market Breadth
- 7. Limitations of Bitcoin Dominance
- 8. Conclusion
For now, the question “does Bitcoin dominate or not?” is not the one we ask when analyzing the crypto market; it is “by how much?” At a glance, the answer shows whether Bitcoin or the broader altcoin field is leading the market and attracting capital. This guide breaks down the formula, the market signals, the cycle behavior, and the main limitations of this metric that can distort what the number is really telling you.
Bitcoin Dominance Definition and Formula
A preliminary step to estimating the estimated value of one or all cryptocurrencies at once is market cap; if you need to catch up with the market capitalization definition, see our glossary first.
If Bitcoin’s market cap serves as an approximation of the value of all bitcoins in circulation, Bitcoin dominance (BTC.D) measures its share of the total crypto market cap, expressed as a percentage. It is calculated by dividing Bitcoin's market capitalization by the total market capitalization of all tracked cryptocurrencies and multiplying by 100. This single number tells you how concentrated the crypto market's value is in Bitcoin versus everything else.
Bitcoin Market Cap Share
Bitcoin's market cap share is built from two specific inputs: BTC price multiplied by circulating supply, not max supply. Circulating supply counts only the coins currently in active circulation, while max supply refers to the theoretical hard cap of 21 million BTC that will ever exist.
As a matter of fact, all market-cap-based dominance calculations use circulating supply. It reflects coins actually available to trade and hold value today, rather than tokens that have not yet been mined or released.
There is another metric to gauge the value of a crypto project if all tokens were in circulation: fully diluted value (FDV). We have a guide explaining what FDV in crypto is, so read that guide for the complete picture.
Total Crypto Market Cap
The “total crypto market cap” figure is an aggregate across many assets, and its exact value can differ depending on index composition — meaning which coins are included in the count — and the methodology used to calculate each asset's market capitalization.
This is a critical nuance: some providers calculate dominance using a subset of coins, or index constituents, rather than every token in existence. For example, TradingView's BTC.D calculation draws from a defined group, which can produce a different dominance reading than a calculation that attempts to include “all crypto”.
Bitcoin Dominance Calculation
The formula in equation form is: Bitcoin Dominance (%) = (Bitcoin Market Cap ÷ Total Crypto Market Cap) × 100
For example, suppose it’s 2021, Bitcoin's market cap is $800 billion and the total crypto market cap across all tracked assets is $2 trillion. Divide $800 billion by $2 trillion, which equals 0.4. Multiply 0.4 by 100, and Bitcoin dominance comes out to 40%.
The calculation seems straightforward but a few pitfalls can make it completely uninformative: mixing fully diluted valuation with circulating market cap, which inflates or distorts the Bitcoin market cap figure used in the ratio; comparing dominance values across different sites without checking whether they use the same constituent set; or using stale supply or price timestamps, where one input reflects a different moment than the other, skewing the resulting percentage.
Live Tracking Sources
Where do you track metrics like BTC.D and avoid these pitfalls, then? Readers can track Bitcoin dominance in real time through a handful of established platforms:
- TradingView (BTC.D) — a dedicated dominance index/ticker that plots Bitcoin's market share as its own chartable symbol;
- CoinMarketCap — displays a computed Bitcoin dominance percentage on its main market overview page, based on the market capitalization and circulating supply data it aggregates;
- CoinGecko — provides a similar dominance metric alongside broader market capitalization rankings, letting readers cross-check the ratio against its own listed asset universe;
- TradingView community indicators — several custom scripts and overlays let readers overlay dominance trends directly onto price charts for visual comparison.
So far we have established the mechanical channel: what the ratio is and how it is calculated. The narrative channel begins when traders start interpreting that line as evidence of capital rotation, risk appetite, or market stress.
Market Signals From Bitcoin Dominance

Bitcoin dominance can send two different kinds of signals: a level signal asks whether dominance is high or low relative to its own historical range, while a trend signal asks whether it is currently rising or falling regardless of where it sits historically.
Neither means much in isolation. Interpretation always depends on what is simultaneously happening to total market cap and BTC price, since the ratio can move for reasons that have little to do with market sentiment.
High Bitcoin Dominance
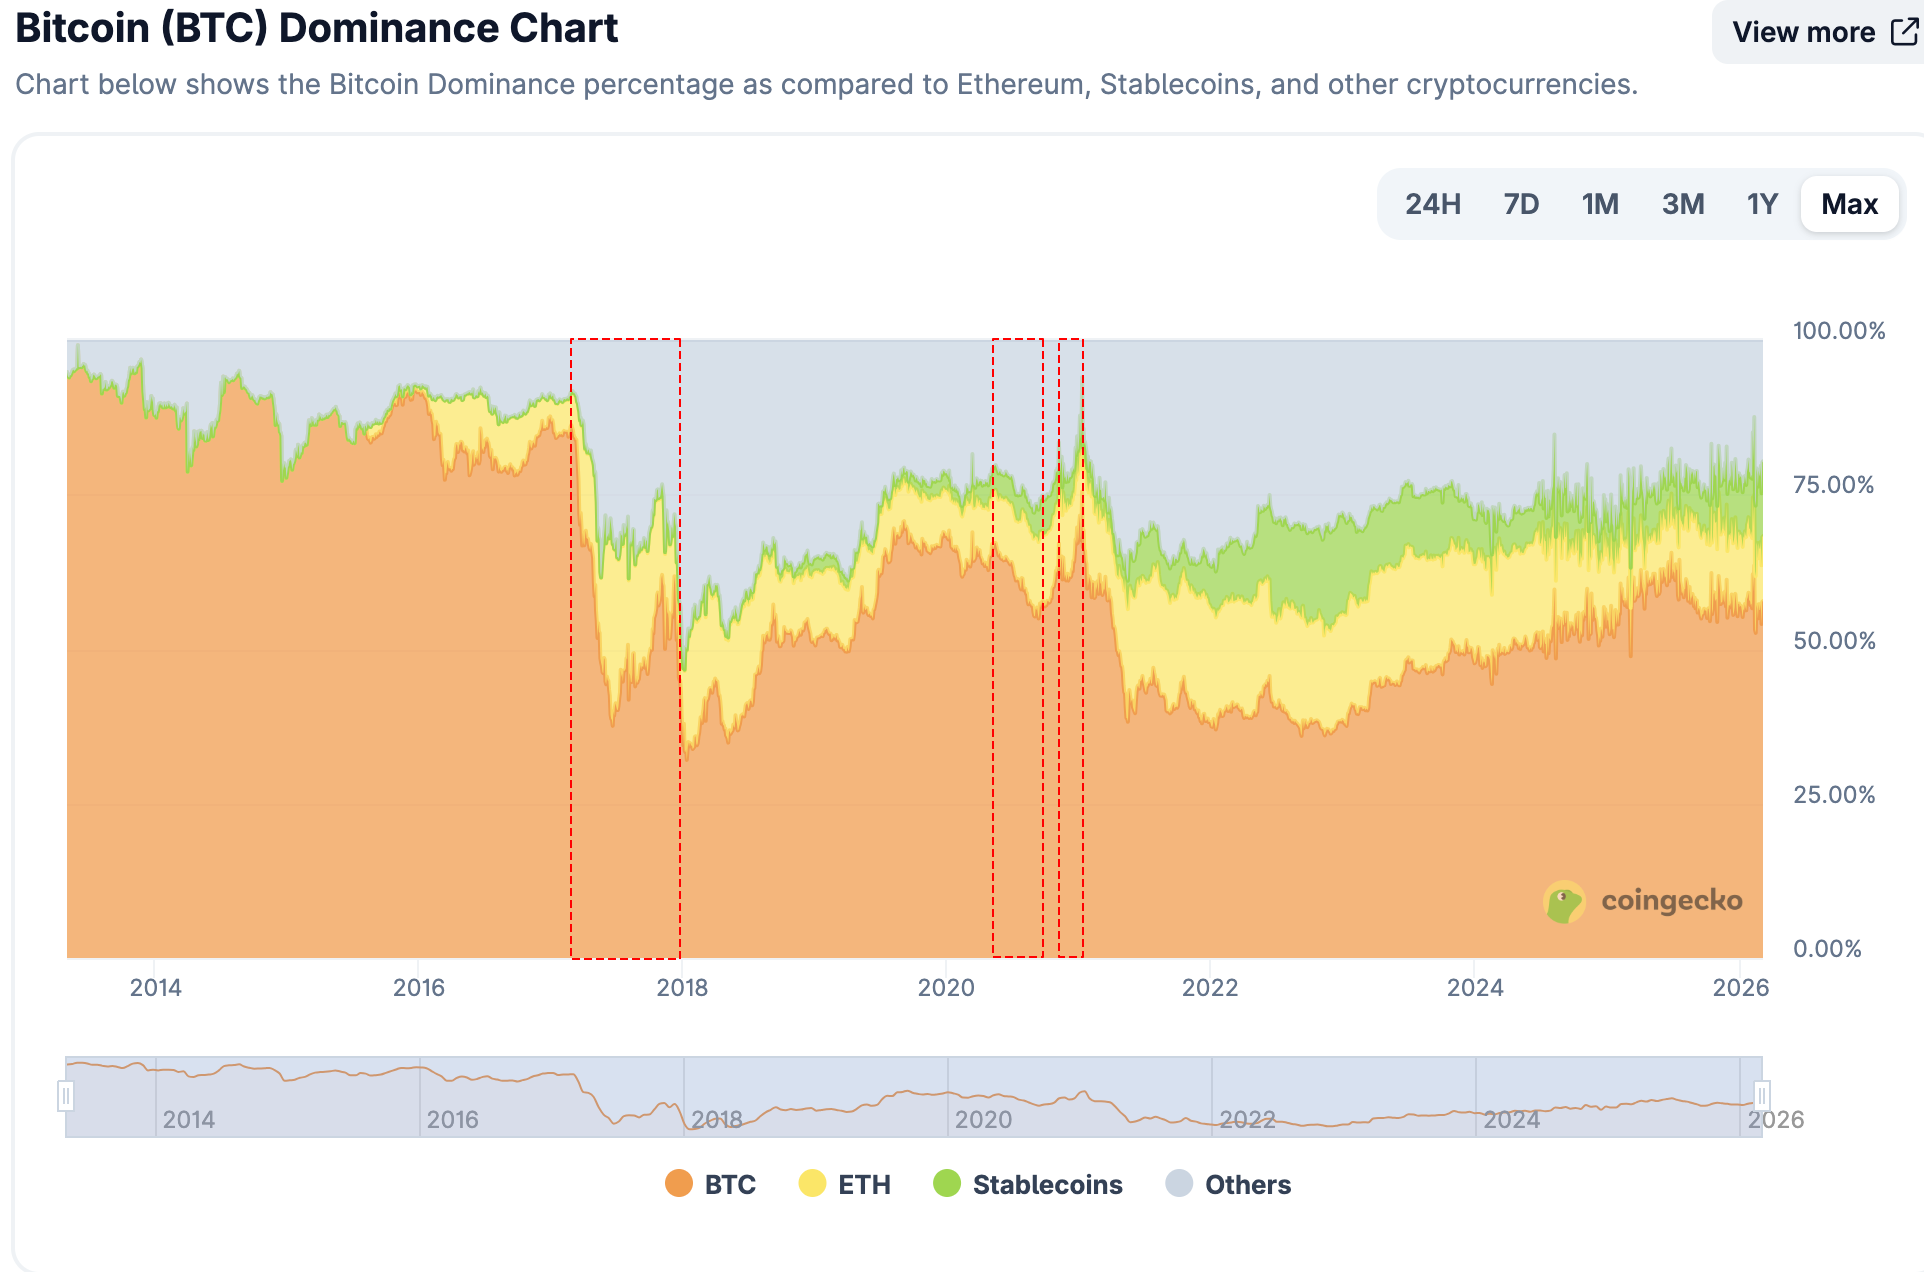
What is considered to be a high level for this indicator? Some traders suggest that it flipping 50% is already a cause to shift gears. However, in the current market, 60% and above is a more reasonable level; BTC.D has stayed above that level for about 50 days in 2026 so far. The highest it’s been in the past five years is 66%.
When Bitcoin dominance sits at elevated levels, it often coincides with a recognizable set of market behaviors, although none of these are guaranteed outcomes:
- Flows can concentrate into Bitcoin as traders favor its perceived liquidity and quality over smaller-cap alternatives;
- Altcoin moves often show reduced breadth, meaning fewer tokens participate in any given rally;
- Risk appetite tends to compress, with capital gravitating toward the asset seen as the “safer” crypto allocation;
- Market sentiment can lean cautious, reflecting a preference for consolidation over speculative rotation into smaller assets.
A high BTC.D reading does not automatically mean Bitcoin is in a strong uptrend. It can also mean altcoins are weakening faster.
Falling Bitcoin Dominance
Logically, a falling dominance trend mirrors the above but usually points toward broadening participation rather than concentrated capital: more sectors of the market can start moving simultaneously, rather than gains being confined to Bitcoin alone; correlation among altcoins often increases as capital spreads across multiple tokens at once; and dispersion between winners and losers tends to widen, since broader participation does not mean uniform performance.
This year, late May to early June has seen BTC.D fall from 60.76% to 57.94%. It coincided with the BTC price going from $77K to $67K, so the decrease in price alone could have contributed to that. A third component clears the trend up: the total market cap moved in the same direction while relative to each other, the shares of dominance of major altcoins and the rest of the market stayed on the same level, proving that it was the case.
Falling dominance can occur during both rising and falling total market cap conditions, so it should never be read as automatically “bullish” — the denominator's behavior matters just as much as the trend itself.
Capital Rotation
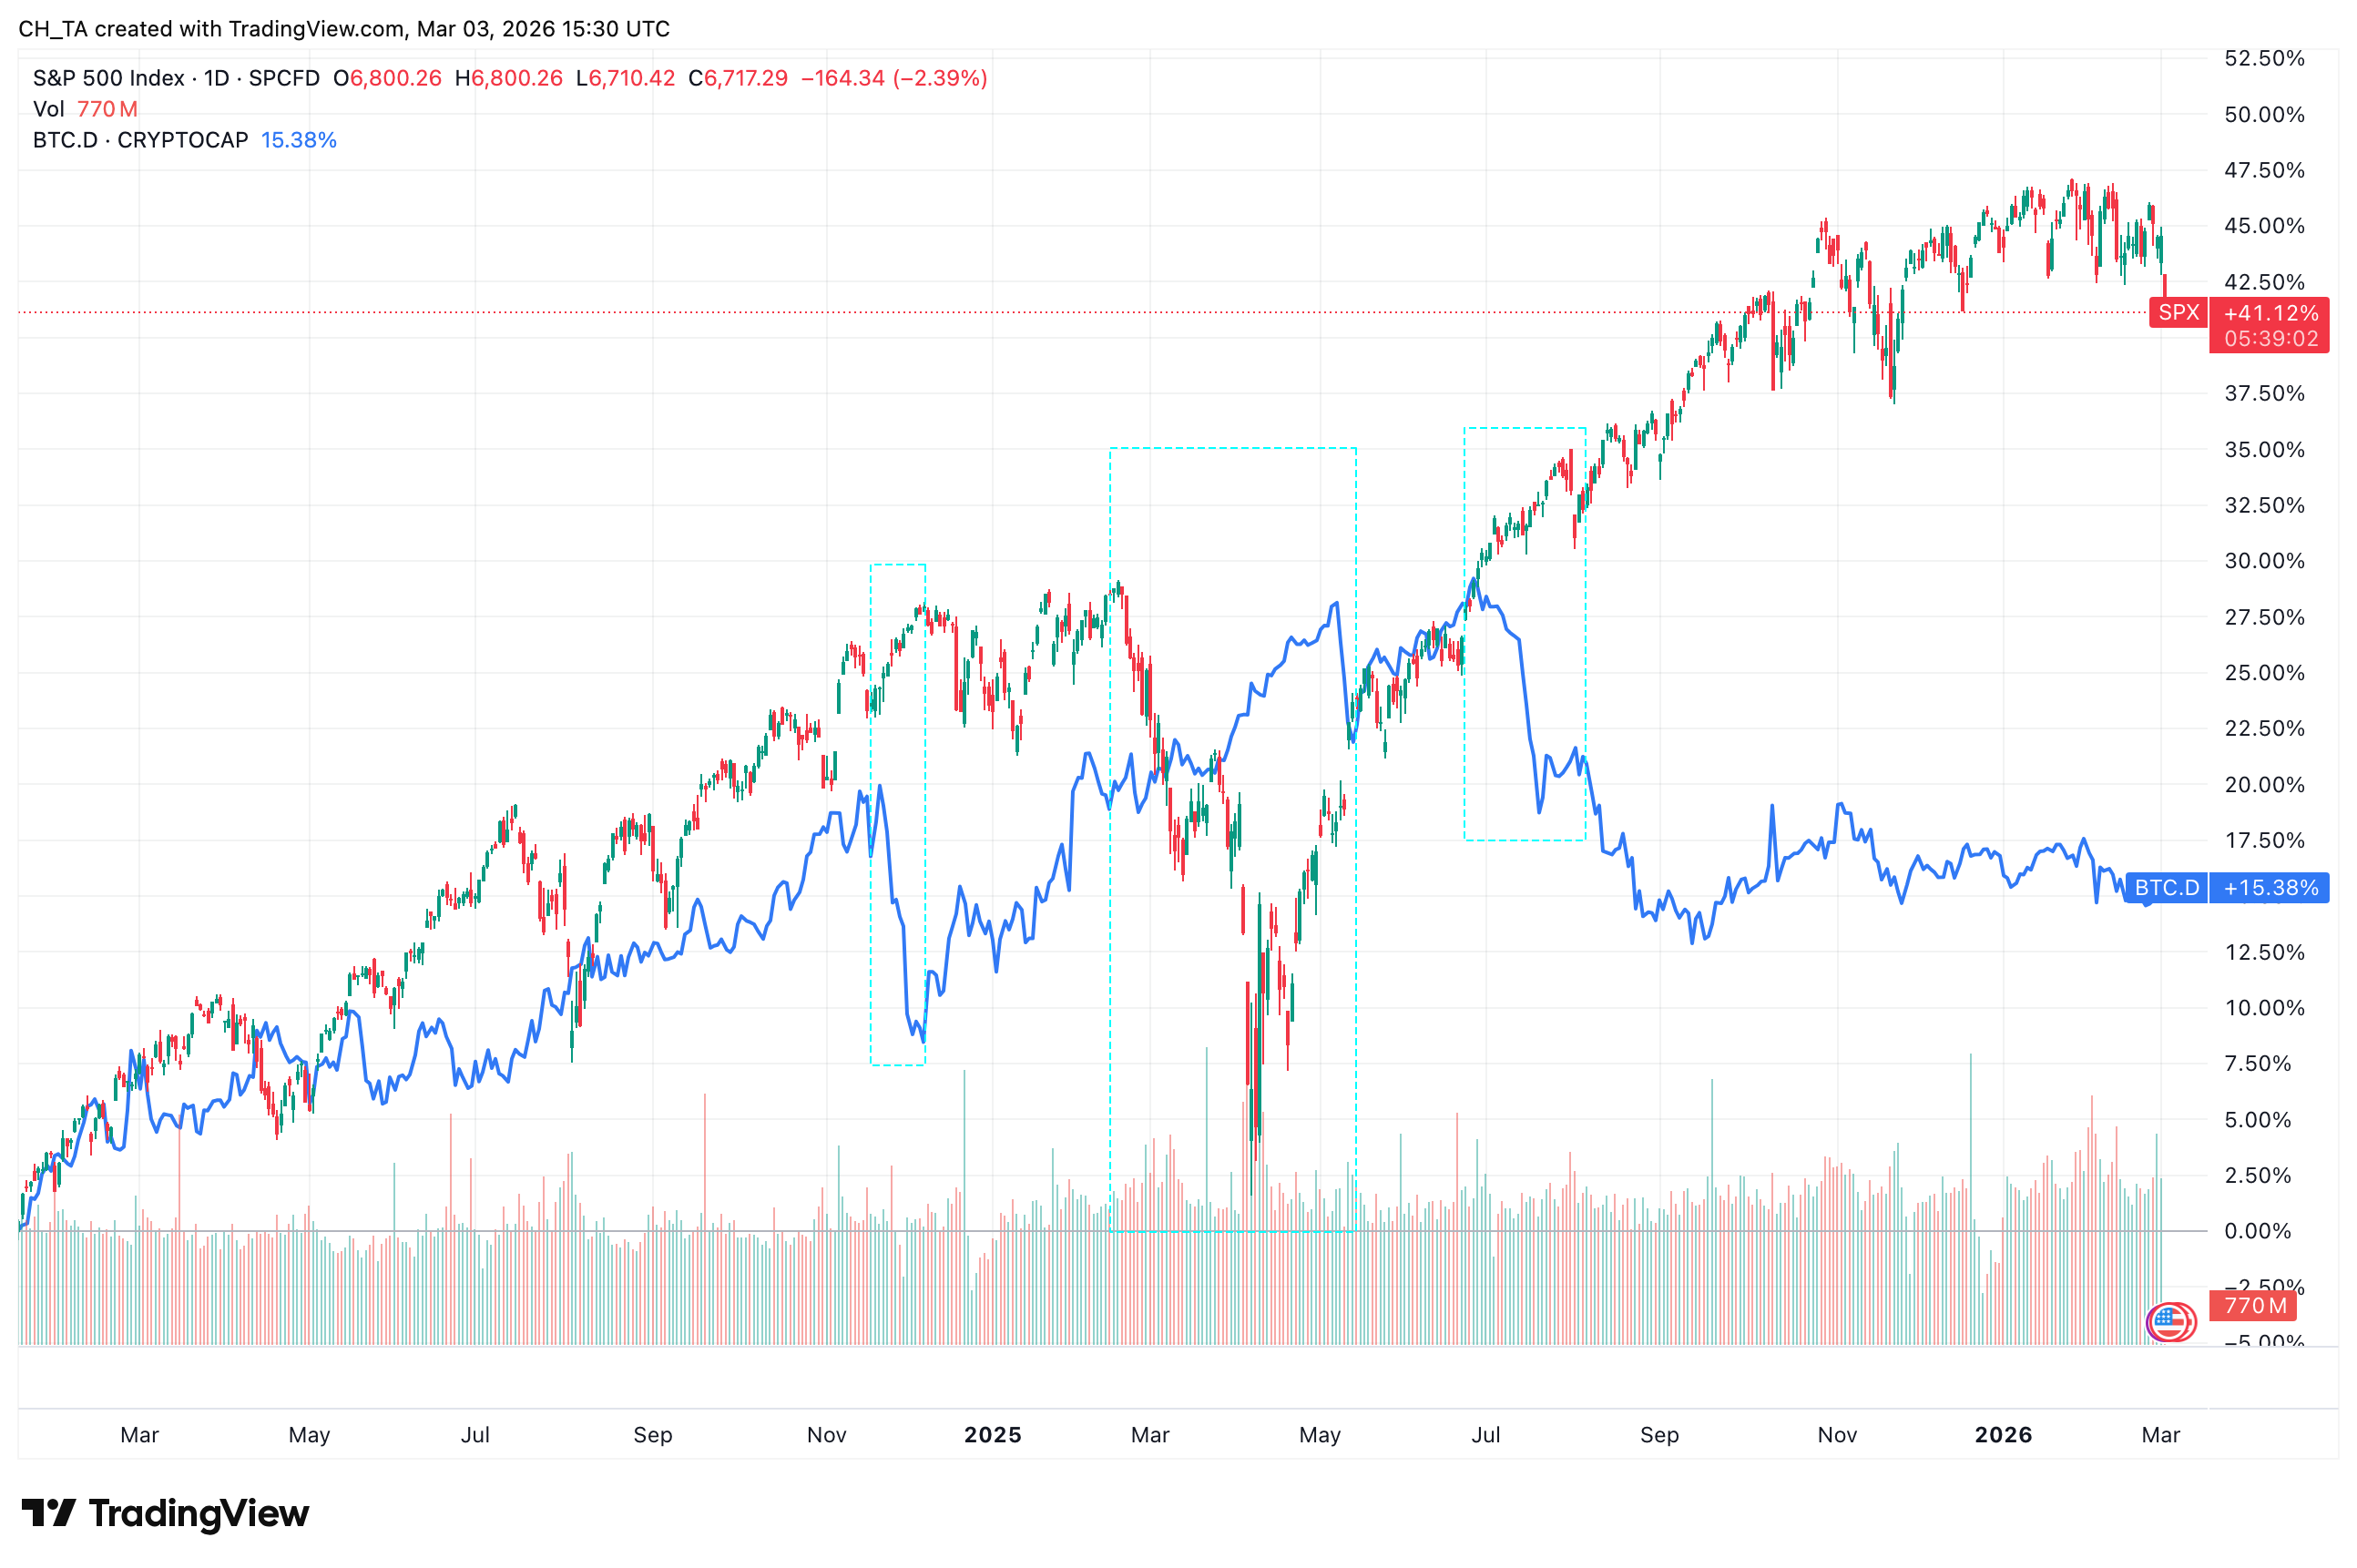
Speaking of capital rotation, it describes a sequence, not a single event. It typically unfolds in three general steps: Bitcoin leads a move higher, profits then rotate into large-cap altcoins as traders seek relative value, and later that rotation can extend into smaller-cap tokens as risk appetite broadens further down the market.
To validate whether this kind of rotation is actually occurring rather than assumed, use a short checklist:
- Compare the direction of BTC.D against the direction of total market cap — divergence between the two often signals genuine rotation rather than a shared move;
- Check whether trading volume is distributing across a wider set of assets or remaining concentrated in Bitcoin alone;
- Confirm the pattern holds over more than a single session, since one-day moves can reflect noise rather than sustained rotation.
Investor Confidence
Bitcoin dominance shifts can reflect two distinct, sometimes opposite, interpretations of investor confidence. Rising dominance can indicate a risk-off posture within crypto, where investors prefer Bitcoin as the relatively safer allocation amid uncertainty. Falling dominance, on the other hand, can suggest a risk-on/risk-off shift toward risk-on behavior, where investors are willing to take on more relative risk across altcoins in pursuit of higher returns.
Hopefully, the example above demonstrates that dominance alone should never be treated as a standalone market sentiment proxy. It needs to be read alongside price action and total market cap context to mean anything reliable.
Bitcoin Dominance Across Market Cycles
A market cycle, in this context, is best understood operationally as the rotation of leadership and liquidity between Bitcoin and altcoins as risk appetite expands or contracts.
BTC.D does not move for a single reason. It can rise or fall depending on whether Bitcoin price, altcoin prices, or the total market cap denominator is doing the heavy lifting at any given moment. The bull market, bear market, and altseason regimes below show how the same dominance line can mean different things depending on where the market is in the cycle.
Bull Market Phases
Bull markets rarely move as a single, uniform phase for dominance. They tend to split into two distinct sub-phases with contrasting dominance behavior.
Phase A: BTC-led expansion. This is the early bull phase, where Bitcoin trends strongly higher while dominance stays flat-to-rising, since capital concentrates in BTC before spreading further out.
- Returns are concentrated in Bitcoin, with altcoins lagging or moving in a narrower range relative to BTC's trend;
- Altcoin participation stays thin — rallies in smaller tokens tend to be shallow or short-lived compared to Bitcoin's move.
Phase B: broadening rally. As the bull market matures, dominance often rolls over as capital disperses into large-cap alts and beyond.
- Breadth increases noticeably, with a wider set of altcoins posting gains alongside or ahead of Bitcoin;
- Return concentration shifts away from BTC, as large-cap and then smaller-cap alts start capturing a larger share of overall market gains.
Bear Market Phases
Bear markets also split into two distinguishable stretches, and dominance behaves differently in each.
Early bear. Altcoins typically underperform first in this stretch. Dominance can actually rise even while the entire market is falling, since altcoins are often sold off faster than Bitcoin.
Late bear / capitulation-to-base. Dominance can stay elevated through this stretch, but it can also drift lower if Bitcoin selling itself becomes severe, since dominance reflects a ratio, not an absolute price floor.
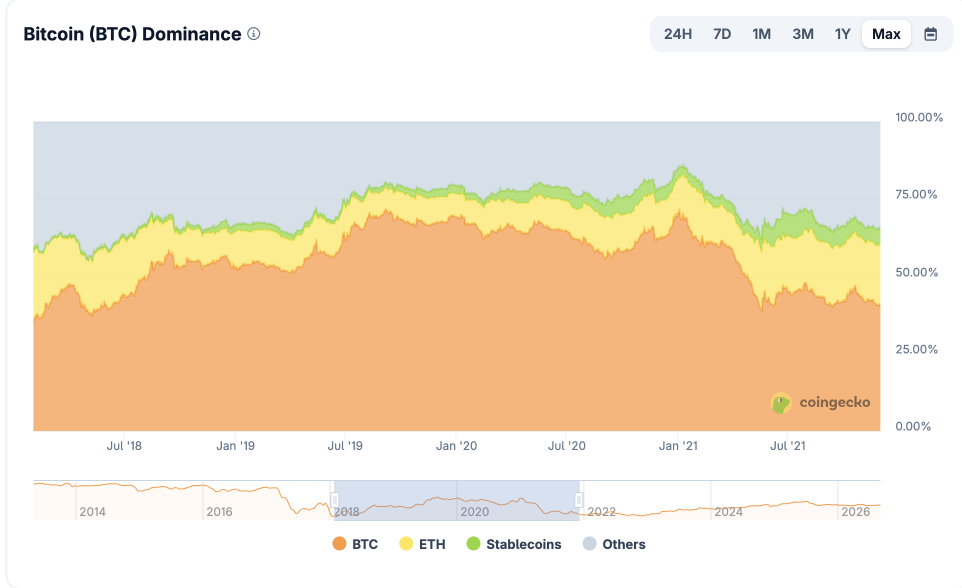
By the way, rising dominance during a bear market is not a guarantee that Bitcoin is going up. It can simply reflect relative resilience against altcoins during a broader drawdown, which is a very different signal than outright strength.
Altcoin Season
What is altcoin season? Altseason is a regime where a broad set of altcoins outperform Bitcoin for a sustained period, and this typically corresponds with a sustained downtrend in Bitcoin dominance rather than a single sharp move.
Leadership shifts first from Bitcoin to large-cap altcoins like Ethereum, and later cascades into smaller-cap tokens as risk appetite broadens. There is also increased dispersion among winners, with a wider range of tokens posting standout returns rather than gains concentrating in one or two assets. Narratives too rotate faster, as capital chases whichever theme or sector is currently capturing attention across the altcoin field.
Dominance falling does not automatically confirm altseason. It can also be driven by denominator changes or stablecoin supply effects.
Historical Dominance Trends
A compact timeline helps anchor these regimes to real historical reference points:
- Early market, pre-altcoin era → ~100% dominance → Bitcoin was effectively the entire crypto market, so dominance had nowhere to go but down as new coins launched;
- 2017 bull run → dominance fell from >60% to <40% → a textbook broad-alt-participation phase, where altcoin gains outpaced Bitcoin across the board;
- 2021 bull run → dominance dropped from ~70% to ~40% → another broadening rally, echoing the 2017 pattern but from a higher starting dominance level;
- January 2024, BTC spot ETF approval → ~49% dominance → a modern reference point tying dominance to a major market-structure event and a starting point for the current evaluations;
- April 2024, halving → ~50% dominance → another contextual snapshot around a structural event.
These days, BTC.D floats closer to 60%.
These event-adjacent dominance levels are snapshots in time, not causal proof that ETF approvals or halvings directly move dominance in a predictable direction. They simply mark where the ratio stood when the news landed, and each market cycle since has shown its own variation on the bull market, bear market, and altseason patterns described above.
Bitcoin Dominance Charts and Indicator Setups
Reading Bitcoin dominance correctly starts with knowing exactly what you are looking at on the chart, then layering in the right levels, pairings, and confirmation signals before treating any move as meaningful.
BTC.D Chart Structure
Most charting platforms let you pull up Bitcoin dominance as its own dedicated chart or ticker. On TradingView, for example, you search “BTC.D” the same way you would search for a trading pair.
What you are actually viewing is a percentage series, not a tradable coin: there is no order book, no volume of BTC.D itself changing hands, and no way to “buy” the ratio directly. It is a dominance index — a technical indicator derived from market cap data, plotted purely to track relative share over time.
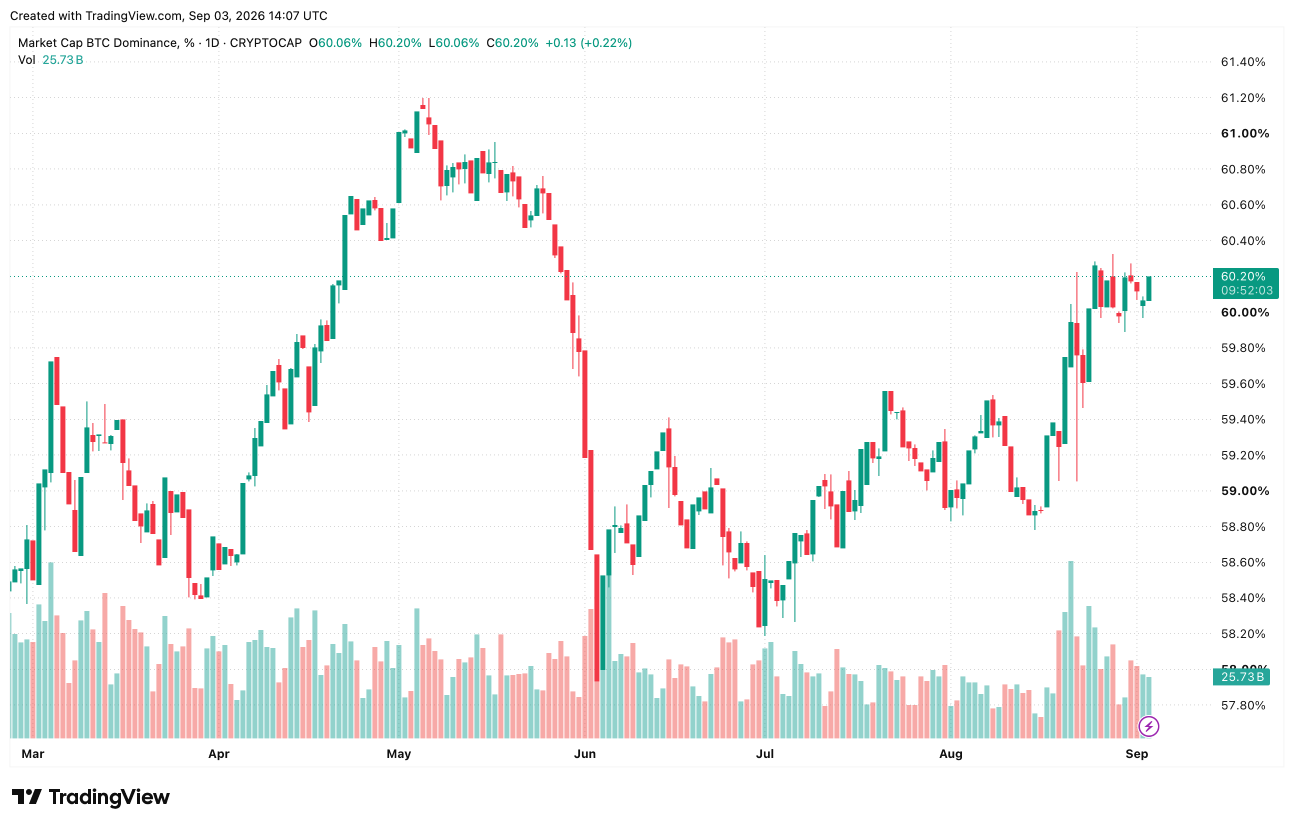
TradingView's BTC.D, specifically, is calculated using the overall market cap of the top 125 coins, which means it can read differently than a calculation drawing from a broader or narrower “all crypto” universe. This is not a bug. It is a definitional difference, and it means your platform consistency rule should be simple: pick one data source for your analysis and stick with it whenever you are marking levels, so you are not comparing lines drawn on two different underlying datasets.
Chart setup defaults worth locking in before you analyze anything:
- Timeframe pairing — use a daily chart to read the broader dominance regime, and a 4-hour chart to time entries or confirm shorter-term shifts within that regime;
- Log vs. linear scale — since BTC.D is a percentage series bounded between 0 and 100, a linear scale is generally the appropriate choice; log scaling is built for series with exponential range, which does not apply the same way to a bounded ratio;
- Moving averages — optional overlays, such as a simple or exponential moving average, can help smooth chop, but no single indicator is required to read dominance meaningfully;
- Volume context — cross-reference dominance moves against overall crypto trading volume on your price charts, since a dominance shift on unusually thin volume carries less weight than one accompanied by heavier participation.
Support and Resistance Levels
Making BTC.D a chart is not arbitrary; it can be interpreted using the technical analysis playbook. Drawing levels on BTC.D follows a similar logic to price charting but applied to the dominance ratio itself. Here is how a trader would go about it:
- Identify prior swing highs and lows in dominance — scan the daily chart for points where BTC.D visibly reversed direction, marking each as a candidate level;
- Convert those points into zones, not single lines — because dominance often chops sideways rather than reacting cleanly at one exact value, treat each candidate as a support zone or resistance area spanning a small range rather than a hairline;
- Demand at least two touches plus a visible reaction before treating a zone as validated — a single touch is not enough evidence that the level matters.
Mind that dominance can form clean, well-respected levels even while Bitcoin's own price is stuck in a range. Because dominance is a relative measure, it can trend or reverse based on how altcoins are behaving, independent of what BTC price itself is doing.
Before labeling any dominance level break as a risk-on or risk-off shift, check whether total crypto market cap is expanding or contracting — a break in dominance means something different in each case; and see whether BTC price itself is trending or ranging, since a dominance break during a range-bound BTC price often signals something different than one occurring alongside a strong BTC trend.
Bitcoin Price Pairing

Comparing BTC.D against other series side-by-side is what lets you separate Bitcoin strength from altcoin weakness from a simple denominator effect. Not just any metric will do, though:
- BTC.D vs. BTC/USD shows Bitcoin's absolute price trend directly, letting you see whether Bitcoin is rising or falling in dollar terms independent of its market share;
- BTC.D vs. TOTAL, total crypto market cap shows whether the overall market is expanding or contracting alongside dominance, helping isolate whether a dominance move is being driven by Bitcoin or by the denominator;
- BTC.D vs. a broad alt proxy — comparing dominance against a wide basket of altcoins highlights whether smaller assets are gaining or losing ground as a group, a topic covered in more depth in the dedicated OTHERS section later in this guide.
BTC up, BTC.D up means Bitcoin is outpacing altcoins; strength is concentrated in BTC itself. BTC up, BTC.D down signals that the broader market is likely rising faster than Bitcoin, meaning altcoins are outperforming even as BTC gains. BTC down, BTC.D up is the opposite — altcoins are falling faster than Bitcoin, so dominance rises on relative resilience rather than actual BTC strength. Finally, BTC down, BTC.D down means Bitcoin is underperforming the broader market even as both are likely under pressure, pointing to capital favoring alts despite a weak overall backdrop.
Trend and Breakout Signals
A BTC.D breakout should not be taken at face value the moment price pokes through a zone. Before treating it as a genuine trend signal:
- Close beyond the zone on your chosen timeframe, daily for regime-level breaks, not just an intraday wick through the level;
- Retest and hold behavior — watch whether price returns to the broken zone and holds as new support or resistance rather than immediately reversing back through it;
- Alignment with the higher-timeframe trend — a 4H breakout that contradicts the daily trend deserves more skepticism than one moving in the same direction;
- Cross-check against BTC price and total market cap direction — a dominance breakout that lines up with what BTC price and total market cap are doing is far more convincing than one that contradicts both.
One failure mode is unique to dominance charts and worth flagging explicitly: short-lived spikes can appear simply because a large altcoin's market cap shifted abruptly, or because stablecoin supply expanded or contracted, both of which move the denominator without reflecting any real change in Bitcoin's own trend. When a breakout looks sudden and unexplained by BTC price action alone, it is worth consulting the later sections before treating it as a confirmed signal.
Stablecoin Dominance and Liquidity Rotation
By the same definition, stablecoin dominance is the share of total crypto market cap held by stablecoins as a group. It functions here as a context layer for interpreting Bitcoin dominance rather than as its own standalone signal.

Liquidity rotation describes capital moving between stablecoins, which represent parked, cash-like positioning, and risk assets like BTC, ETH, and alts, which represent active positioning. Read alongside BTC.D, these two ideas help separate a genuine rotation into Bitcoin from a simple denominator effect caused by stablecoin supply changes.
USDT Dominance
Tether's USDT is the largest stablecoin by market cap. Tracking its dominance on its own is already indicative of a few trends but what the trends actually are depends on what the charts evidence.
USDT dominance rising because USDT market cap is expanding, fresh issuance/inflows usually signals liquidity sitting on the sidelines, often read as cautious or risk-off positioning building up in cash-like form.
USDT dominance rising because risk assets' market caps are falling, denominator shrink typically means the move is not about stablecoin demand at all; it reflects BTC, ETH, and alts losing value while USDT supply stays roughly flat, so liquidity appetite has not actually changed direction.
When the USDT dominance stays flat while BTC.D rises, this points to rotation within risk assets, capital moving into Bitcoin rather than into stables, which usually signals a risk-on-but-selective posture rather than broad risk-off behavior.
USDC Dominance
Despite USDC also being a top valued crypto asset, its dominance is considerably lower (under 3%) to be viewed substantially on its own. However, it can provide an interesting contrast when viewed with USDT’s dominance share trends.
USDC dominance rising while USDT dominance stays flat can imply liquidity concentrating on venues or user bases that prefer USDC, rather than a market-wide shift into cash-like positioning — the mechanism differs even if the net “stablecoin dominance” figure looks similar.
The opposite can imply capital rotating between stablecoin types rather than between stablecoins and risk assets at all, which would otherwise be mistaken for a broader risk-off signal if only the combined stablecoin dominance number were reviewed.
For what it’s worth, watching USDT and USDC as separate series, rather than only a blended stablecoin dominance figure, helps clarify whether liquidity is genuinely entering or leaving risk assets or simply moving between stablecoin issuers.
Stablecoin Inflows and Outflows
For this framework, an inflow is defined as net growth in total stablecoin market cap, and an outflow is net shrinkage in that same figure. Mapping stablecoin dominance direction against total crypto market cap direction produces four distinct read-outs:
- Stablecoin dominance up, total market cap up — stables are growing faster than the market is expanding, which can indicate stablecoins acting as “dry powder” accumulating alongside a rising market rather than being deployed into risk assets yet;
- Stablecoin dominance up, total market cap down — stables are holding or growing share while risk assets shrink, a pattern that typically points to parking-asset behavior consistent with risk-off positioning;
- Stablecoin dominance down, total market cap up — stablecoin share shrinking while the market grows usually indicates dry powder being rotated back into risk assets, consistent with risk-on behavior;
- Stablecoin dominance down, total market cap down — this combination can indicate stablecoin supply itself contracting, redemptions, rather than any bullish rotation, so it should not automatically be read as risk appetite improving.
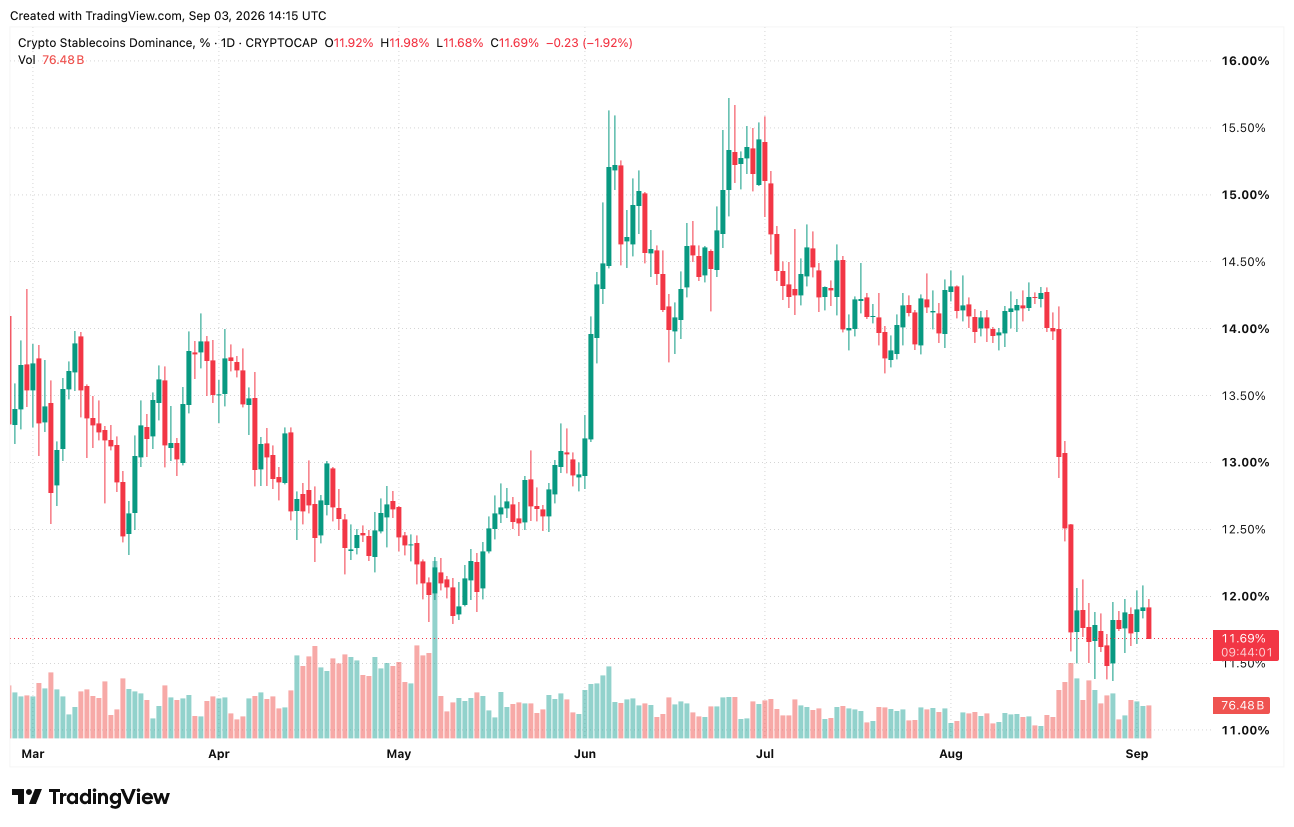
Comparing stablecoin dominance direction against BTC.D direction helps separate risk-off via stables, capital parking in cash, from risk-off via BTC, capital consolidating into Bitcoin instead. The same comparison against total market cap direction can confirm whether the move reflects genuine liquidity rotation or simply a shrinking or expanding denominator.
Risk-On and Risk-Off Signals
Stablecoin dominance trends can be read as conditional signals for the broader risk regime, without prescribing any specific action: for one, sustained stablecoin dominance up while total market cap is flat or down often signals risk-off positioning, since liquidity is accumulating in cash-like assets rather than being deployed. Stablecoin dominance down while total market cap expands often signals risk-on conditions, since liquidity is flowing out of stables and into risk assets as the market grows.
Stablecoin dominance up while BTC.D also rises can indicate a flight-to-Bitcoin-plus-cash pattern, where capital is simultaneously seeking relative safety in BTC and parking excess liquidity in stables. Stablecoin dominance down while market breadth improves can reinforce a risk-on read.
As is the case with BTC.D, falling stablecoin dominance is not automatically bullish if total market cap is also contracting, since that combination can simply reflect stablecoin supply itself shrinking rather than capital rotating into risk assets.
OTHERS Dominance and Market Breadth
Typically, “OTHERS” means everything excluding Bitcoin, and often several other top-cap assets as well, depending on how the specific chart or index defines its constituents. Because OTHERS is not a universally standardized category, always verify the exact composition of your data source before drawing conclusions or comparing values across platforms.
OTHERS Market Share
Reading OTHERS share alongside BTC.D direction gives a more precise picture of where capital is actually moving than either metric alone:
- OTHERS share rising while BTC.D is falling signals dispersion away from Bitcoin into smaller assets, consistent with broadening risk appetite across the long tail of the market;
- OTHERS share falling while BTC.D is rising signals concentration back into Bitcoin, consistent with narrowing risk appetite and a retreat from smaller-cap exposure;
- OTHERS share flat while BTC.D falls suggests the rotation may be concentrating into large-cap altcoins rather than the long tail — a distinction explored further in the next section.
Before comparing values across different charts or platforms, confirm which assets are excluded (BTC only, BTC plus ETH, or a top-N set of coins, stablecoins) and if the list is capped at a number of assets or attempts to capture the total crypto market.
Large-Cap Altcoin Influence
Not every altcoin-favorable move reflects the same underlying dynamic. Stacking three readings together — BTC.D, a major alt's dominance such as ETH share, and OTHERS — creates a simple hierarchy for where capital is concentrating at any given moment, without needing to introduce any additional metrics beyond what is already on the chart.
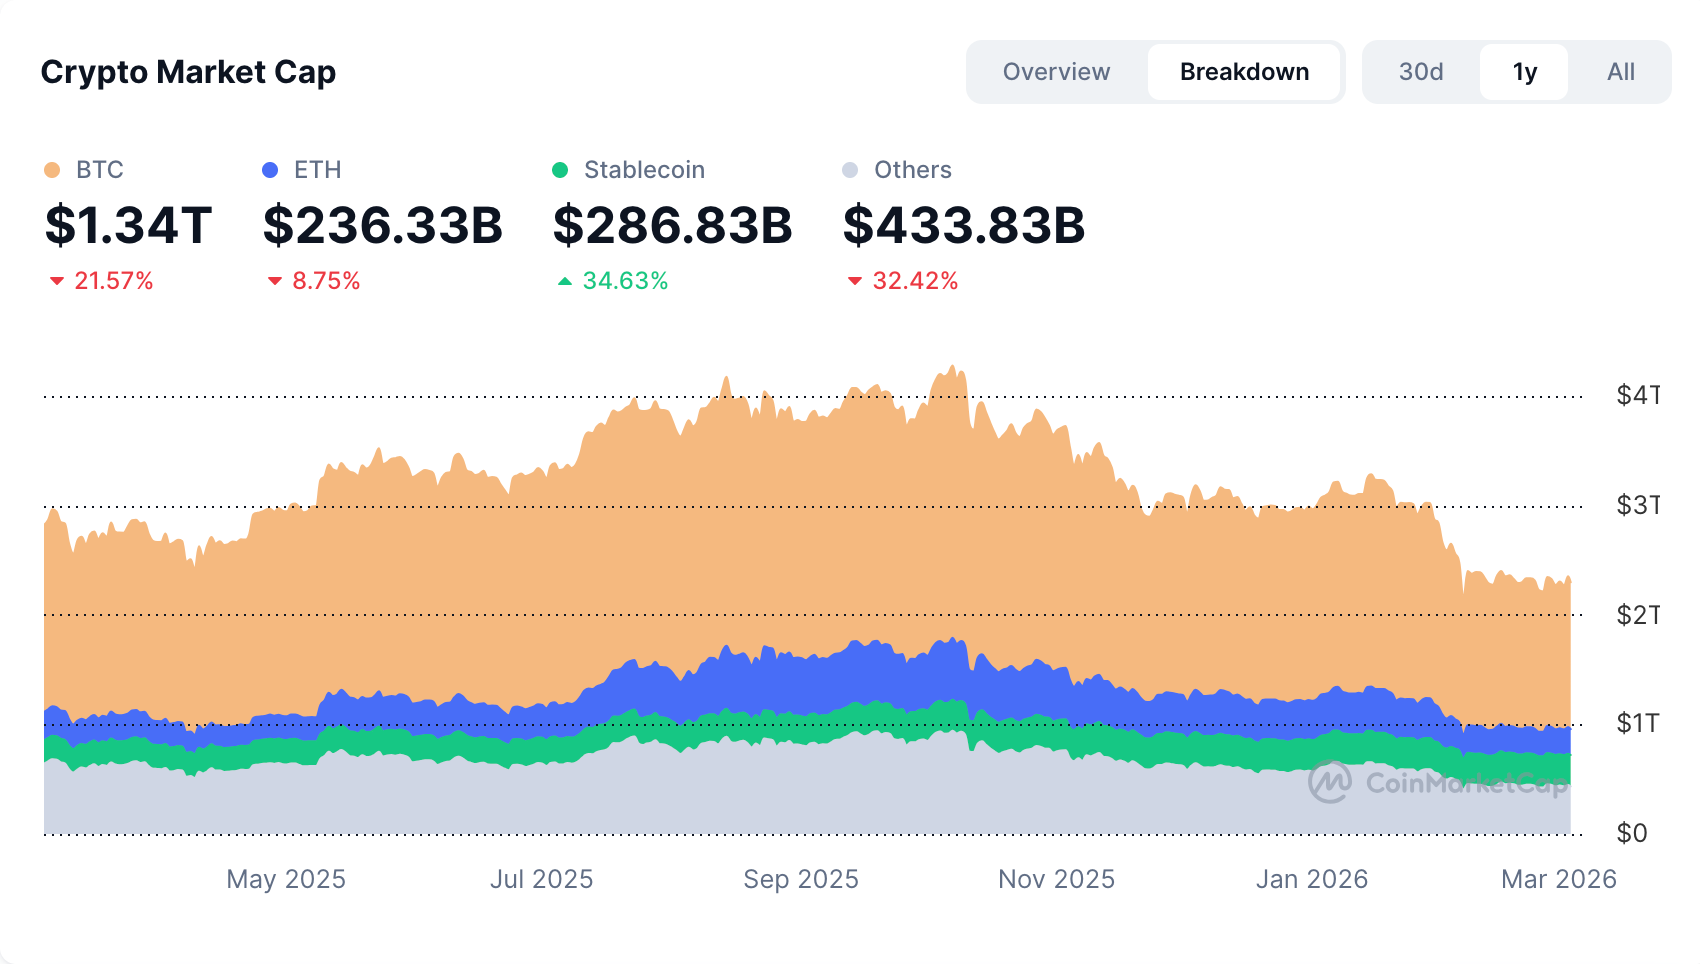
One failure mode worth flagging directly: a single large-cap altcoin's sharp move can inflate total market cap enough to look like broad-based breadth, even when most other alts are lagging behind. Because the aggregate OTHERS figure can be skewed by one or two outsized movers, confirmation should come from the breadth signals rather than from the aggregate number alone.
Market Breadth Signals
Market breadth asks a different question than dominance alone: are gains spread across many assets, or concentrated in a handful of leaders? A few concrete, observable checks help answer that without relying on any proprietary tool: more coins outside of the top making higher highs, sector participation increasing, with multiple categories moving together, and volume distribution broadening beyond BTC and ETH into a wider set of tokens.
OTHERS share rising does not automatically confirm altseason, when it may simply reflect a handful of large-cap alts moving. Additionally, a single large-cap altcoin pump, which can move this category, cannot be proof of broad participation on its own without cross-referencing.
Limitations of Bitcoin Dominance
At the end of the day, BTC.D is a ratio, not an absolute reading, and ratios can move for three separate reasons: the numerator, Bitcoin's own market capitalization, changes; the denominator, everything else in the total, changes; or the underlying basket being measured shifts entirely.
Market Cap Distortions
Several structural quirks can push Bitcoin dominance up or down without reflecting any real change in market sentiment or capital flow:
- Liquidity vs. market cap mismatch — a thinly traded token can print a large market capitalization on paper without the trading depth to actually absorb meaningful buy or sell orders, meaning its weight in the total does not reflect real investable liquidity;
- Circulating-supply reporting variance — different data providers can use slightly different circulating-supply figures for the same asset, which shifts that asset's market cap, and therefore BTC.D, even when no price has moved at all;
- Fully diluted valuation, FDV, vs. circulating market cap confusion — some totals blend FDV-based figures for certain tokens with Bitcoin's circulating-based market cap, and mixing the two breaks comparability outright, since one side of the ratio reflects tokens that do not yet exist in circulation while the other reflects only coins actually available today;
- Concentration effect — a handful of large non-BTC assets moving sharply can swing the denominator on their own, masking what is actually happening across the broader altcoin field;
- Timing mismatch — if BTC price and altcoin prices or market caps are sampled at different moments across providers, the resulting ratio can be internally “correct” yet inconsistent with what a same-timestamp calculation would show.
When comparing BTC.D readings across different sites, verify whether each one calculates market capitalization on a consistent circulating-supply basis and whether the total market cap universe behind the ratio stays the same from one comparison to the next.
Stablecoin Supply Effects
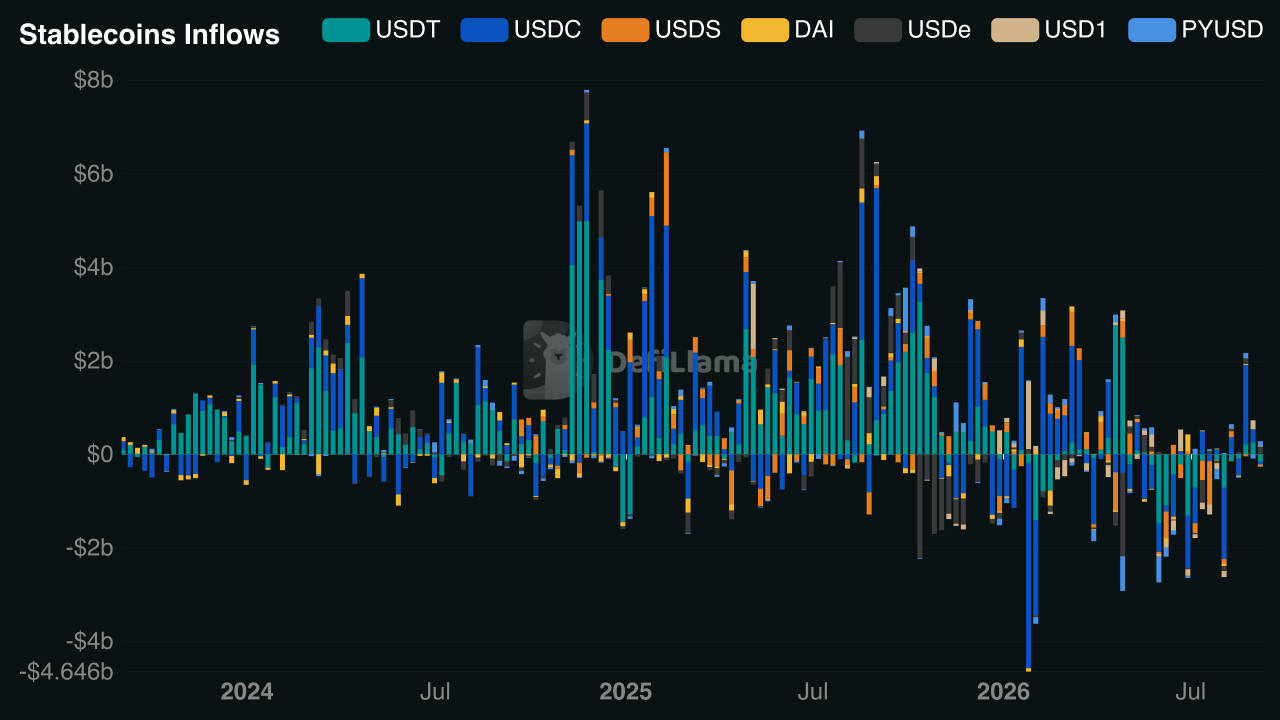
Stablecoin supply changes affect the denominator directly, and the two directions produce opposite — and easily confused — effects on the dominance reading: stablecoin market cap expansion pushes the denominator higher as fresh issuance adds to total crypto market cap. Because Bitcoin's own market cap does not need to change at all for this to happen, BTC.D can mechanically drift lower even while Bitcoin's price is flat or rising.
On the other hand, stablecoin market cap contraction shrinks the denominator as stablecoin supply is redeemed or burned. This can mechanically push BTC.D higher even though Bitcoin is not gaining any real relative strength against the rest of the market.
Wrapped Bitcoin and Duplicate Exposure
Wrapped BTC is a tokenized representation of Bitcoin issued on another blockchain, designed to track BTC's price so it can be used within that chain's ecosystem.
The distortion risk comes from how aggregators count it. If a data provider includes both native Bitcoin's market cap and one or more wrapped BTC tokens' market caps in the same total crypto market cap figure, Bitcoin's economic exposure ends up represented twice in the denominator. This skews BTC.D without reflecting any real change in the market.
Alternative Dominance Metrics
- BTC dominance excluding stablecoins — measures Bitcoin's share of the market once stablecoin supply is stripped from the denominator, fixing the stablecoin-driven noise described above. Use it when you specifically want to isolate Bitcoin's standing against other risk assets, not against cash-like tokens;
- BTC vs. ETH share side-by-side — plots Bitcoin's and Ethereum's shares against each other rather than collapsing everything into one number, fixing the one-number blindness that hides which of the two majors is actually leading. Use it when the question is about leadership between the two largest assets specifically;
- Dominance within a defined index universe — calculates dominance against a fixed, named set of constituents rather than a loosely defined “all crypto” total, fixing cross-site comparability problems. Use it when you need dominance readings from different tools or time periods to actually line up.
Pick the dominance variant that matches the specific question being asked — Bitcoin against alts, majors against the long tail, or risk-on/off behavior via stablecoins — and keep the underlying universe consistent over time so the readings stay comparable.
Conclusion
Bitcoin dominance is a ratio, and reading it well means always asking what is moving: the numerator, the denominator, or the underlying basket of coins being measured.
Across this guide, the recurring theme has been that no single reading of BTC.D means anything in isolation. It needs context from total market cap direction, BTC price action, stablecoin supply shifts, and breadth signals across the market before it can be interpreted with any confidence.
Keep an eye on the ChangeHero blog to learn more about the latest crypto news, projects, and platforms. And for quicker bite-sized updates, follow us on social media: Twitter, Facebook, and Telegram.
Frequently Asked Questions
Is Bitcoin dominance a reliable metric for trading?
No, Bitcoin dominance is not reliable as a standalone trading signal. It functions best as a context or relative-strength gauge rather than an entry/exit trigger.
The ratio needs to be read alongside BTC price direction and total crypto market cap direction, since a move in dominance alone can be easily misinterpreted without knowing which side of the equation is actually driving it. Treated in isolation, the number can suggest a story that the underlying price action does not actually support.
How does Bitcoin dominance relate to altcoin season?
Altcoin season often aligns with a sustained downtrend in Bitcoin dominance, reflecting relative outperformance across a broad set of alts rather than just a few names.
That said, a falling dominance value alone does not prove broad alt outperformance is occurring, since the denominator behind the ratio can shift independently of any real rotation. For the full picture, compare BTC.D with total crypto market cap, OTHERS dominance, and the limitations around stablecoin supply effects.
What factors influence Bitcoin dominance?
Three categories drive changes in Bitcoin dominance: shifts in Bitcoin's own market capitalization, shifts in the market capitalization of everything else, major alts plus the long tail of smaller tokens, and differences in how total market cap is composed or calculated across data sources.
Because of this second and third factor, dominance can move even if BTC price is flat, simply because the rest of the market or the measured universe itself is changing. This is why the ratio should never be read as a pure reflection of Bitcoin's own price behavior.
Why has Bitcoin dominance declined over time?
The core reason dominance has declined over the long run is that the crypto market added many non-BTC assets — both alts and stablecoins — expanding the denominator and competing for a growing share of total market capitalization.
Even so, dominance can still rise during risk-off periods despite this long-run decline, since it is a relative measure that reflects Bitcoin's standing against everything else at a given moment, not an absolute trend that only moves in one direction.