How to Read Candlesticks (with Candlestick Pattern Cheat Sheet)

Key Takeaways
- 🕯️ One candle = one completed interval of OHLC (Open, High, Low, Close). The body shows net progress (Open→Close); the wicks show exploration + rejection (High/Low probes that failed to hold). Read the candle in this order: Close vs Open (who “won”), Body vs Range (commitment vs hesitation), Wick asymmetry (where the market rejected), and Close location (conviction near extremes vs indecision in the middle).
- 🕯️ Candlestick patterns are signals, not triggers: the candle shape is a setup—confirmation (volume, structure, follow-through) is what turns it into a tradable decision.
- 🕯️ Context is the real filter: the same candle means different things depending on regime (trend vs range) and location (support/resistance/swing points). Patterns in “open space” are usually noise; patterns at structure carry weight.
Contents
Japanese candlestick patterns give you a visual shorthand for spotting potential price reversals and continuations across almost any liquid market. Once you can recognize the most common bullish, bearish, and neutral pattern candlestick formations at a glance, you stop reacting late and start thinking in actionable probabilities.
These patterns apply across stocks, ETFs, forex pairs, and, of course, cryptocurrency markets, and work on timeframes ranging from 15-minute intraday charts to weekly view and monthly views. In this guide, we’ll give an overview of how to read candlestick patterns with regards to the market context, which imbues these signs with actual meaning.
Candlesticks and Candlestick Charts Explained
A candlestick chart visualizes price action by encoding Open, High, Low, and Close (OHLC) data within individual candles, each representing a completed time interval chosen by the trader. Its signature component, a candle, also called candlestick reveals the intraperiod battle between buyers and sellers, offering a compressed visual summary of market control that shifts meaning dramatically based on position, sequence, and timeframe. If you want candlestick patterns to feel intuitive rather than mystical, start here: the anatomy tells you what happened, and context tells you what it likely means.
Price Components
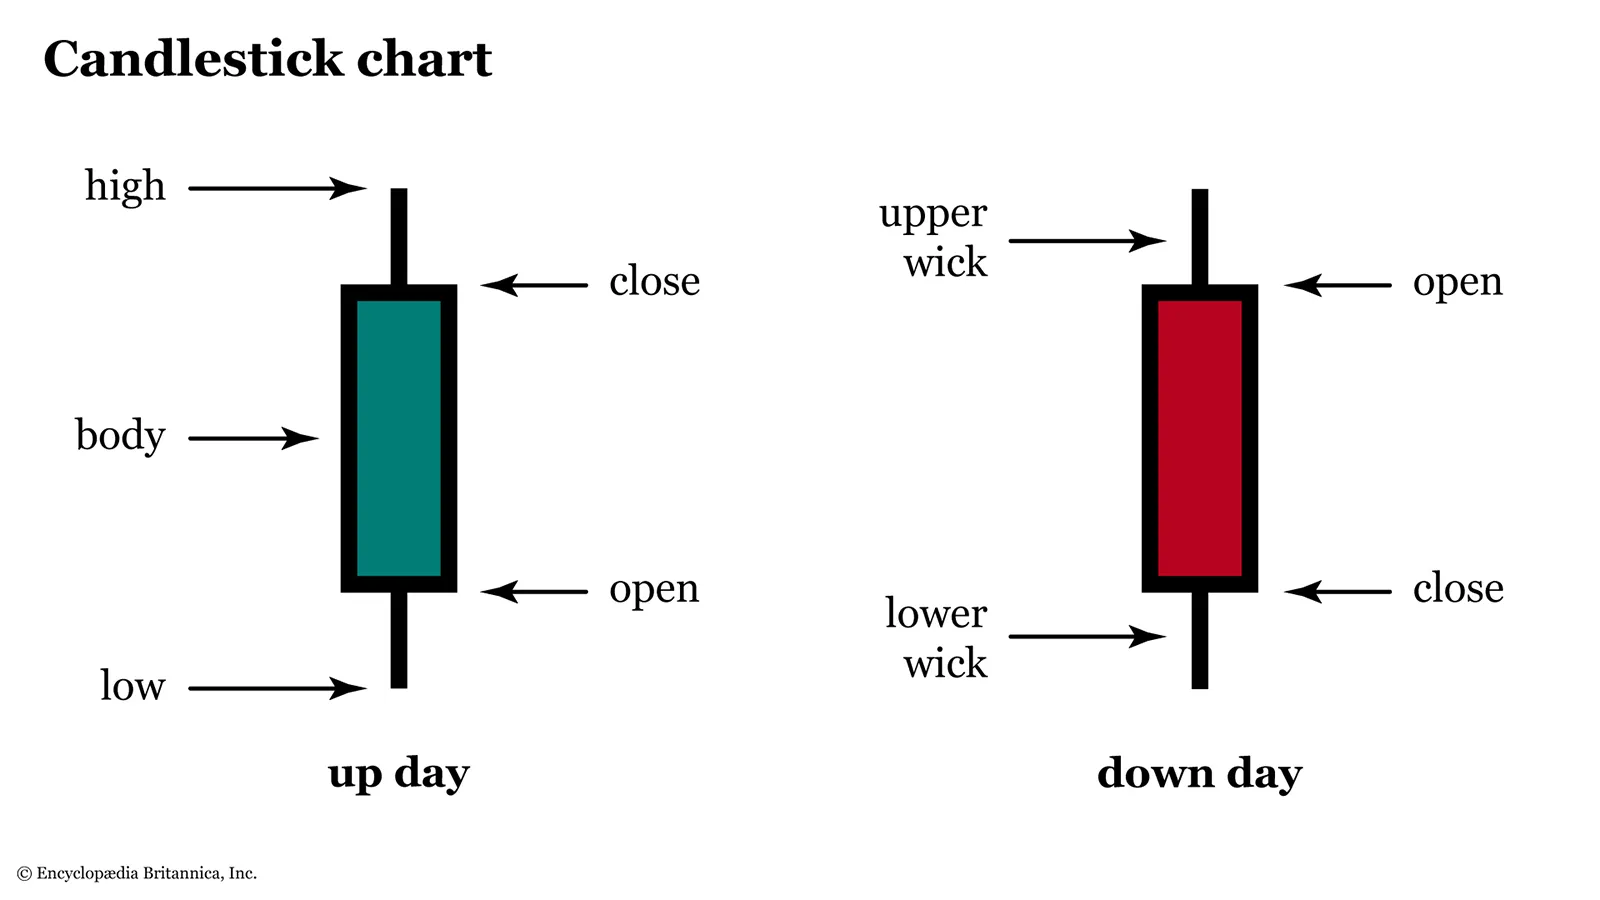
A candlestick chart displays price action through three visual components: the real body (spanning Open to Close), wicks or shadows (extending to High and Low), and color (indicating whether Close exceeds Open).
The thicker real body represents the open-to-close price range: when close is higher than open, the body typically displays as hollow, light-colored or green, signaling buyer dominance. When close falls below open, the body appears filled or dark, often red, indicating seller control. The color convention varies across platforms but contrast is the most important common theme. Color reflects the relationship between Close and Open, not whether an asset is in an uptrend or downtrend.
If the body is the bold part of a candle, thin lines are wicks or shadows. The upper wick (or shadow) extends from the top of the real body to the session's high. The lower wick (or shadow) stretches from the bottom of the real body to the session's low. Wicks capture price rejection—the distance between where buyers or sellers attempted to push price and where it ultimately settled.
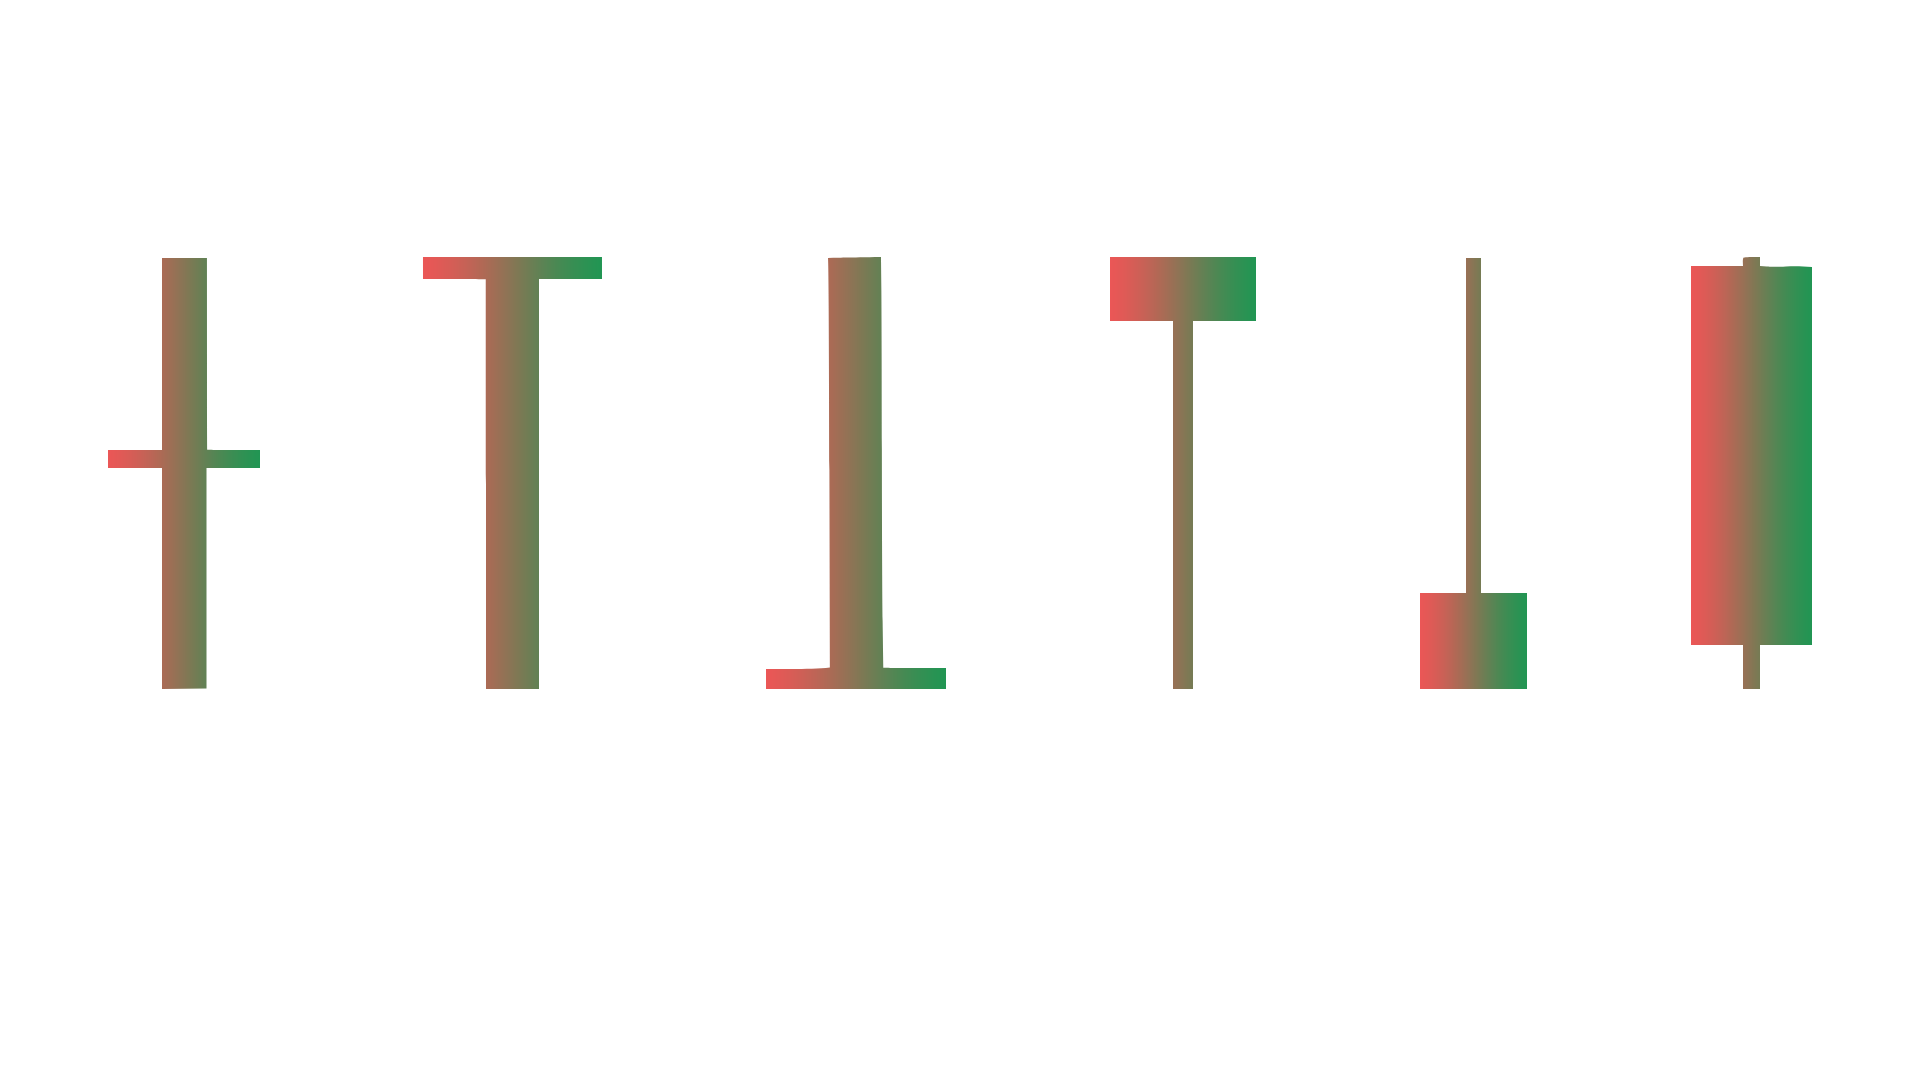
Looking slightly ahead, there are some edge cases classified as patterns of their own right. A Doji candle forms when open and close are near-equal relative to the candle's overall range and timeframe—there's no hard numeric threshold unless you standardize one for your strategy, but visually the body should be negligible compared to the wicks. This near-equal condition often shows an indecisive close, so signals market indecision. Marubozu candles feature no wicks or very small wicks, meaning the high matches (or nearly matches) the close in a bullish Marubozu, and the low matches the open; this signals uninterrupted directional pressure throughout the session. Long-wick candles can result from sudden volatility spikes, stop-hunts, or illiquid prints—they're not automatically reversal signals.
Session Context
Interpreting a single candlestick in isolation is one of the fastest ways to get trapped. Every candle’s meaning shifts based on its surroundings: position, sequence, and relative size.
Timeframe effects also change the odds. A hammer pattern on a 5-minute chart carries far less weight than the identical formation on a daily or weekly chart. Higher timeframes filter out noise, aggregate more participants, and generally produce more reliable signals.
How to Read Candlestick Patterns
Before diving into the patterns themselves, it makes sense to go over the prerequisites that turn candlesticks into interpretable signals. Each pattern should be filtered through the context before it even means anything; that context covers price trends, trading range and pattern’s placement, support and resistance levels at the very least.
Trend
Trend identification, in turn, requires you to identify three distinct layers before interpreting any candlestick: direction, strength, and the nature of the current swing.
Direction is straightforward—higher highs and higher lows define uptrends, lower highs and lower lows mark downtrends. Strength, however, demands closer observation of candle bodies. Strong trends produce consecutive closes in the direction of the move, with bodies larger than wicks. When you see three or four candles in a row closing near their extremes (i.e. high for uptrends, low for downtrends) you’re witnessing sustained pressure.

Bitcoin Rainbow Chart, a historic analysis tool predicated on the idea that Bitcoin follows a long-term uptrend. Source: Blockchaincenter
The critical distinction lies between pullbacks and reversals. Pullbacks in healthy trends show shrinking bodies and increasing wicks pointing against the pullback direction. Conversely, a true reversal candidate displays large counter-trend candles with closes beyond recent swing points, often accompanied by expanding volume.
- If you see a bullish candle during an uptrend pullback at a prior swing low, and the next candle closes above the previous candle’s high, then the pullback is likely complete.
- If a large bearish candle breaks below multiple support levels in an uptrend, wait for the next candle to close below the breakdown point before treating it as reversal confirmation.
- If bodies are shrinking and wicks are growing in the trend direction, expect exhaustion rather than continuation.
If you remember anything about taking the trend into account, it’s never to act on a single candle against trend strength. Confirmation means the next candle validates the signal through its close—not just its wick.
Range
Ranges form when price action demonstrates repeated failure to sustain directional movement, creating a horizontal band of overlapping bodies and mean-reverting swings.
You can identify a range using only price action by watching for three characteristics: breakout attempts that close back inside the established boundaries, candle bodies that cluster around the same price levels over multiple sessions, and swings that repeatedly touch both extremes without trending continuation. When you see a large bullish candle pierce the upper boundary only to be immediately rejected with a bearish close back into the range, that’s the market showing you the supply absorption level.
Within ranges, wicks matter far more than bodies for directional cues. Long upper wicks at the top of the range signal resistance and selling pressure; long lower wicks at the bottom indicate support and renewed buying pressure. The most dangerous mistake is treating mid-range breakouts—single large candles that spike through a boundary—as genuine signals. These often reverse within one or two candles because they lack the sustained order flow.
- At range edges: Trade the rejection. Look for long wicks pointing away from the boundary and a close back into the range. The next candle should confirm by moving toward the opposite edge.
- Mid-range: Avoid new positions entirely. The environment is ambiguous, and single-candle moves frequently reverse without warning. Wait for price to reach a defined edge before evaluating setups.
Support and Resistance
Support functions as an area, not a single precise price or level, because order flow clusters around zones where previous buyers stepped in or sellers exhausted.
To anchor a support zone, identify the recent swing low and observe whether price has tested that area multiple times without breaking below it. Two or three touches that hold create a meaningful level. The zone extends a few ticks or pips around the exact low to account for natural price discovery and wick probes.

The chart and trader notes highlight a support level.
Validation through candlesticks requires specific features: long lower wicks that demonstrate failed attempts to push price lower, and bullish closes that reclaim the zone after an initial probe. For instance, if price wicks down into your support area but closes back above it on the same candle, that’s immediate evidence of buying pressure absorbing the selling pressure. If the next candle opens higher and continues upward, confirmation is complete.
A single wick into support is not confirmation without a corresponding close back above the zone or a subsequent higher low.
Resistance zones function similarly but require additional nuance to distinguish between supply absorption and outright rejection.
When price makes multiple probes into a resistance area, examine the closes carefully. Each attempt closing higher within the resistance zone than the last suggests that buyers are gradually absorbing the selling pressure, which often precedes a breakout. In contrast, repeated long upper wicks with weak closes that fall back into the prior range demonstrate strong rejection and sellers defending the level aggressively.
The breakout versus fakeout difference hinges entirely on closes relative to the resistance level. A genuine breakout requires a candle to close fully above the resistance zone, followed by a retest where price returns to the level but holds above it on subsequent closes. An intrabar spike—where the candle’s high pierces resistance but the close settles back below it—is a classic fakeout.
Track the behavior of the candle after the breakout attempt. If price closes above resistance, then the next session immediately gaps down or opens back below the level, that’s distribution, not continuation. Real breakouts maintain their ground through the next candle’s close, often forming a higher low on the retest before resuming upward movement.
Context
Every candlestick pattern must pass through a hierarchical filter before triggering action to prevent premature entries and eliminate the majority of false signals.
Candlestick interpretation hierarchy:
- Market regime: Determine whether you are in a trend (directional bias required) or range (mean-reversion only).
- Location: Identify proximity to support, resistance, or a significant swing point. Patterns near structure carry far more weight than patterns in open space.
- Trigger: Observe the candlestick formation itself—the bodies, wicks, and close relative to the prior candle.
- Confirmation: Wait for the next candle to validate the signal through its close. A bullish trigger needs a higher close; a bearish trigger needs a lower close or a break of prior structure.
- Invalidation: Define in advance where the setup is wrong. If the price closes beyond this level, the idea fails and you exit without debate.
This sequence operates as a quotable decision chain: “Before acting on any candle, I confirm my regime, locate my structure, identify my trigger, wait for my confirmation, and predefine my invalidation.”
Common misreads in context:
- Treating single-candle reversals as reliable against strong trends: A hammer or shooting star in isolation does not override three consecutive trend candles with expanding bodies.
- Ignoring where the candle forms: A bullish engulfing pattern in the middle of a range holds no predictive power. The same pattern at support during a trend becomes actionable.
- Not waiting for the close: Acting on an intrabar move—such as a wick touching support—before the candle closes exposes you to reversals. Confirmation requires a completed candle.
- Confusing a wick probe with a breakout: Upper or lower wicks that extend beyond structure but close back inside the prior range are rejections, not breakouts.
- Overlooking invalidation levels: Entering a setup without knowing the exact price that proves you wrong guarantees emotional exits and inconsistent risk management. Define invalidation before entry, always.
Single-Candle Patterns
Single-candle patterns compress one full session—Open, High, Low, Close—into a single sentiment snapshot. That sounds powerful, but it’s also where beginners overtrade: the candle shape is a setup, not a trigger. Treat these as decision points and let confirmation do the heavy lifting.
Doji
Recognition (shape): Real Body is very small or nearly non-existent relative to the total range; open and close sit within a few ticks of each other, with visible wicks on both sides. The shape resembles a cross, and patterns involving doji can reflect that in the names.
Market meaning (psychology): Buyers and sellers reached a stalemate for that particular session. This suggests the prior trend may be losing steam, but it does not indicate direction without context.
Best context: After an extended move, or at a well-defined support/resistance level.
Confirmation & trigger: Next candle close above the Doji's high is bullish; close below the Doji's low is bearish. Volume expansion strengthens the read.
Invalidation / failure mode: Immediate continuation in the prior trend direction, especially if the next candle closes beyond the opposite wick extreme.
Long-Legged Doji
Recognition (shape): Real Body is minimal, but both Upper Wick and Lower Wick are long; the total range is wider than surrounding sessions.
Market meaning (psychology): Two-sided volatility and uncertainty. It can precede reversal or breakout—confirmation must choose direction.
Best context: After a strong directional move or near a major decision point.
Confirmation & trigger: Close above the high confirms bullish resolution; close below the low confirms bearish resolution.
Invalidation / failure mode: Price keeps trading inside the doji range for multiple sessions, or breaks out and snaps back inside quickly.
Dragonfly Doji
Recognition (shape): Open and close near the high, little to no Upper Wick, long Lower Wick. Often resembles a T shape.
Market meaning (psychology): Rejection of lower prices; buyers reclaimed control by the close.
Best context: After a decline or at known support.
Confirmation & trigger: Next candle closes above the Dragonfly Doji's high; volume expansion strengthens conviction.
Invalidation / failure mode: A close below the Dragonfly Doji’s low negates the rejection signal.
Gravestone Doji
Recognition (shape): Open and close near the low, little to no Lower Wick, long Upper Wick.
Market meaning (psychology): Rejection of higher prices; supply emerged at the highs.
Best context: After an advance or at resistance.
Confirmation & trigger: Next candle closes below the Gravestone Doji's low; increased downside volume helps.
Invalidation / failure mode: A close above the upper wick extreme suggests supply was absorbed.
Hammer
Recognition (shape): Small Real Body near the high, little to no Upper Wick, long Lower Wick at least 2× the body.
Market meaning (psychology): Rejection of lower prices; potential exhaustion of the prior decline.
Best context: After a down move or at support. After an uptrend, the same shape is a Hanging Man.
Confirmation & trigger: Next candle closes above the Hammer high, ideally with increased volume.
Invalidation / failure mode: Close below the hammer’s lower wick extreme negates the bullish thesis.
Hanging Man
Recognition (shape): Same shape as a Hammer, but forms after an uptrend.
- Hammer vs Hanging Man: Identical shape, but trend context determines the label. Hammer appears after a decline (bullish rejection); Hanging Man appears after an advance (potential exhaustion). Both require confirmation.
Market meaning (psychology): Potential exhaustion; sellers managed a meaningful push down during the session.
Best context: After an uptrend or at resistance. Not bearish without confirmation.
Confirmation & trigger: Next candle closes below the Hanging Man’s low; increased selling volume strengthens the signal.
Invalidation / failure mode: Strong continuation higher, especially a close above the Hanging Man’s high.
Inverted Hammer
Recognition (shape): Small Real Body near the low, little to no Lower Wick, long Upper Wick at least 2× the body.
Market meaning (psychology): Buyers attempted a rally after selling pressure; early reversal candidate.
Best context: After a downtrend or at support.
Confirmation & trigger: Next candle closes above the Inverted Hammer's high.
Invalidation / failure mode: Next candle closes below the Inverted Hammer’s low.
Shooting Star
Recognition (shape): Small Real Body near the low, little to no Lower Wick, long Upper Wick.
- Inverted Hammer vs Shooting Star: Same shape, different context. Inverted Hammer appears after a down move; Shooting Star appears after an up move.
Market meaning (psychology): Rejection of higher prices; potential exhaustion of the prior up move.
Best context: After an uptrend or near resistance.
Confirmation & trigger: Next candle closes below the Shooting Star’s low, ideally with volume expansion.
Invalidation / failure mode: A bullish close above the Shooting Star’s high weakens or negates the bearish read.
Marubozu
Recognition (shape): Long Real Body with little to no wicks; opens and closes near high/low levels.
Market meaning (psychology): Strong sustained buying or selling pressure.
Best context: Breakouts, trend starts, and trend continuation.
Confirmation & trigger: Next candle holds near/above the close and continues in the same direction; elevated volume is ideal.
Invalidation / failure mode: Immediate reversal or close below the midpoint.
Two-Candle Patterns
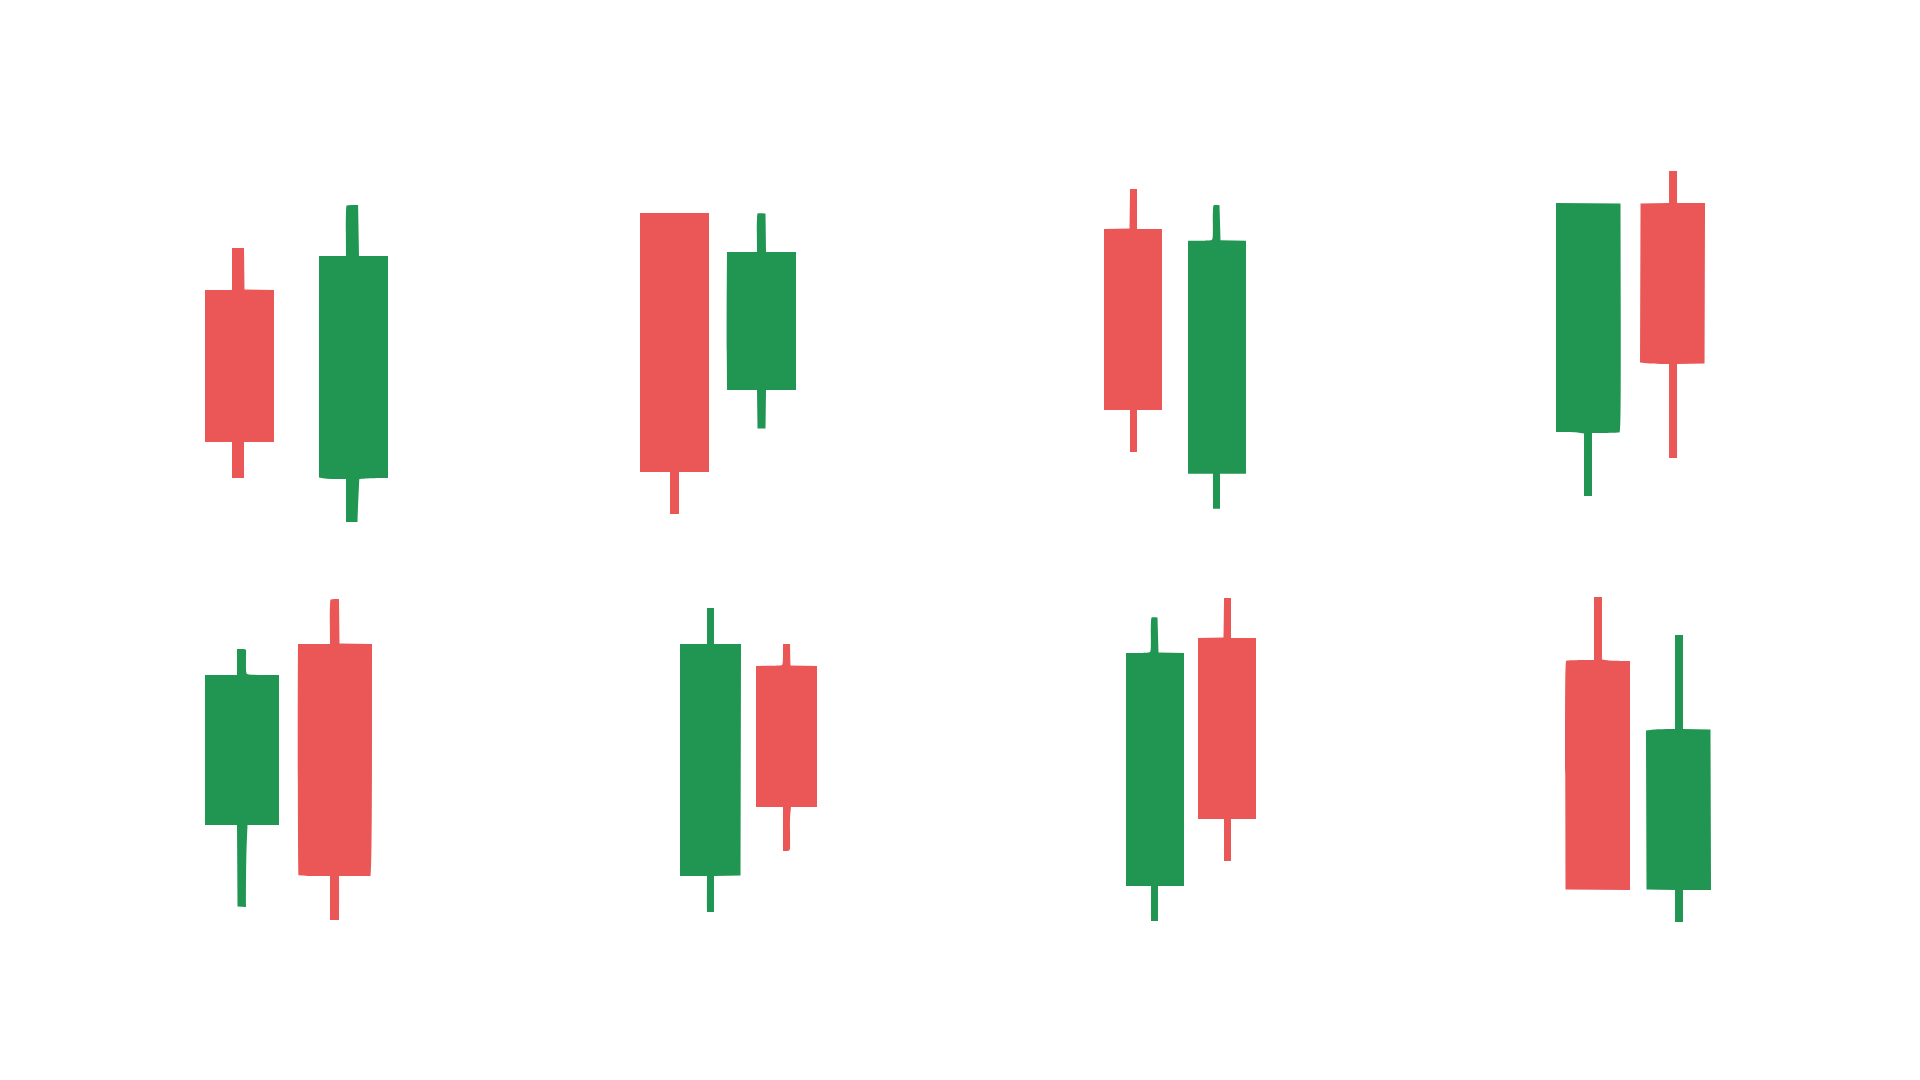
Two-candle patterns focus on how control shifts from one session to the next. In practice, they’re often easier to trade than single-candle patterns because the second candle already introduces a form of confirmation—buyers or sellers didn’t just try, they followed through for at least one full bar.
Bullish Engulfing
Recognition (must-have rules): Downtrend precedes it. Candle 1 bearish. Candle 2 bullish. Candle 2’s Real Body completely engulfs candle 1’s real body (opens at or below candle 1 close, closes above candle 1 open). Full-range engulfing is stronger, but body engulfing is the core requirement.
Market context filter: Best after a decline into established support zones. Degrades in chop and low-volatility drift.
Trader psychology cue: Sellers had control, then buyers overwhelmed them and closed above the prior body—demand took over.
Confirmation checklist: Volume expansion on candle 2 versus the prior 10-session average; candle 2 closes in the upper third; support confluence; higher timeframe structure agrees.
Common invalidation / failure mode: Wick-only engulfing without body dominance; mid-range formation with no support; gap-driven spikes; candle 3 breaks below candle 2 low.
Bearish Engulfing
Recognition (must-have rules): Uptrend precedes it. Candle 1 bullish. Candle 2 bearish. Candle 2’s Real Body engulfs candle 1’s real body (opens at or above candle 1 close, closes below candle 1 open).
Market context filter: Best after an extended rally into resistance. Weaker into strong support.
Trader psychology cue: Buyers pushed higher, then sellers erased the prior body and closed below it—supply took over.
Confirmation checklist: Candle 2 volume > candle 1 volume; close in the lower third; resistance rejection; higher timeframe doesn’t contradict.
Common invalidation / failure mode: Immediate support underneath triggers reversal; gap-driven moves snap back; parabolic uptrends absorb the signal.
Bullish Harami
Recognition (must-have rules): Candle 1 bearish with substantial Real Body (the larger bearish candle). Candle 2 bullish with a real body fully contained within candle 1’s real body. The doji variant is the bullish harami cross.
Market context filter: Best near support after sustained downtrends; less reliable in strong momentum selloffs without support.
Trader psychology cue: Sellers dominated, then momentum stalled—buyers prevented follow-through.
Confirmation checklist: Candle 3 closes above candle 1 high; volume declines on candle 2; bullish divergence on RSI/MACD; support holds.
Common invalidation / failure mode: Inside candle is just a pause; candle 2 body too tiny; candle 3 breaks below candle 1 low.
Bearish Harami
Recognition (must-have rules): Candle 1 bullish with substantial Real Body (the larger bullish candle). Candle 2 bearish with a body fully contained within candle 1’s body. The doji variant is the bearish harami cross.
Market context filter: Higher quality at resistance, weaker mid-trend with no overhead supply.
Trader psychology cue: Buyers pushed strongly, then stalled—sellers began distributing.
Confirmation checklist: Candle 3 closes below candle 1 low; volume declines on candle 2; resistance rejection; bearish divergence.
Common invalidation / failure mode: Strong uptrend absorbs it; candle 2 too small; candle 3 breaks above candle 1 high.
Piercing Line
Recognition (must-have rules): Downtrend precedes it. Candle 1 bearish with significant Real Body. Candle 2 opens below or near candle 1 close, then closes above the midpoint of candle 1 body. Optimal close: 50%–90% into candle 1; above 90% resembles Bullish Engulfing.
Market context filter: Best into established support, weaker mid-range.
Trader psychology cue: Sellers opened strong, buyers reclaimed more than half the prior loss.
Confirmation checklist: Candle 2 closes above the midpoint; volume expands; the open reflects true selling pressure; confirm on higher timeframe.
Common invalidation / failure mode: Close below midpoint disqualifies; no downtrend/support; candle 3 breaks below candle 2 low.
Dark Cloud Cover
Recognition (must-have rules): Uptrend precedes it. Candle 1 bullish with substantial Real Body. Candle 2 opens above or near candle 1 close, then closes below the midpoint of candle 1 body. Optimal penetration: 50%–90%; beyond 90% resembles Bearish Engulfing.
Market context filter: Best into resistance after extended rallies.
Trader psychology cue: Buyers opened strong, then sellers reclaimed most of the prior gain.
Confirmation checklist: Candle 2 closes below midpoint; volume exceeds candle 1; open reflects real strength; resistance rejection.
Common invalidation / failure mode: Occurs after a sell-off bounce (just trend resumption); close above midpoint disqualifies; candle 3 breaks above candle 2 high.
Tweezer Bottom
Recognition (must-have rules): Two consecutive candles with matching lows (exact or within 0.1%–0.3%). Candle 2 closes higher; both candles often show lower shadows touching the same support.
Market context filter: Strongest when aligned with visible support.
Trader psychology cue: Sellers tested the level twice and failed—buyers defended.
Confirmation checklist: Level matches prior support; candle 2 closes in upper half; volume expands on reversal; candle 3 breaks above candle 2 high.
Common invalidation / failure mode: Matching lows mid-range; illiquid prints; candle 3 breaks below the lows.
Tweezer Top
Recognition (must-have rules): Two consecutive candles with matching highs (exact or within 0.1%–0.3%). Candle 2 closes lower; upper shadows show repeated rejection.
Market context filter: Strongest at visible resistance.
Trader psychology cue: Buyers tested the level twice and failed—sellers defended.
Confirmation checklist: Level matches prior resistance; candle 2 closes in lower half; volume expands on the drop; candle 3 breaks below candle 2 low.
Common invalidation / failure mode: Highs match but both candles close strong near highs, showing minimal rejection. Patterns that form
Three-Candle Patterns
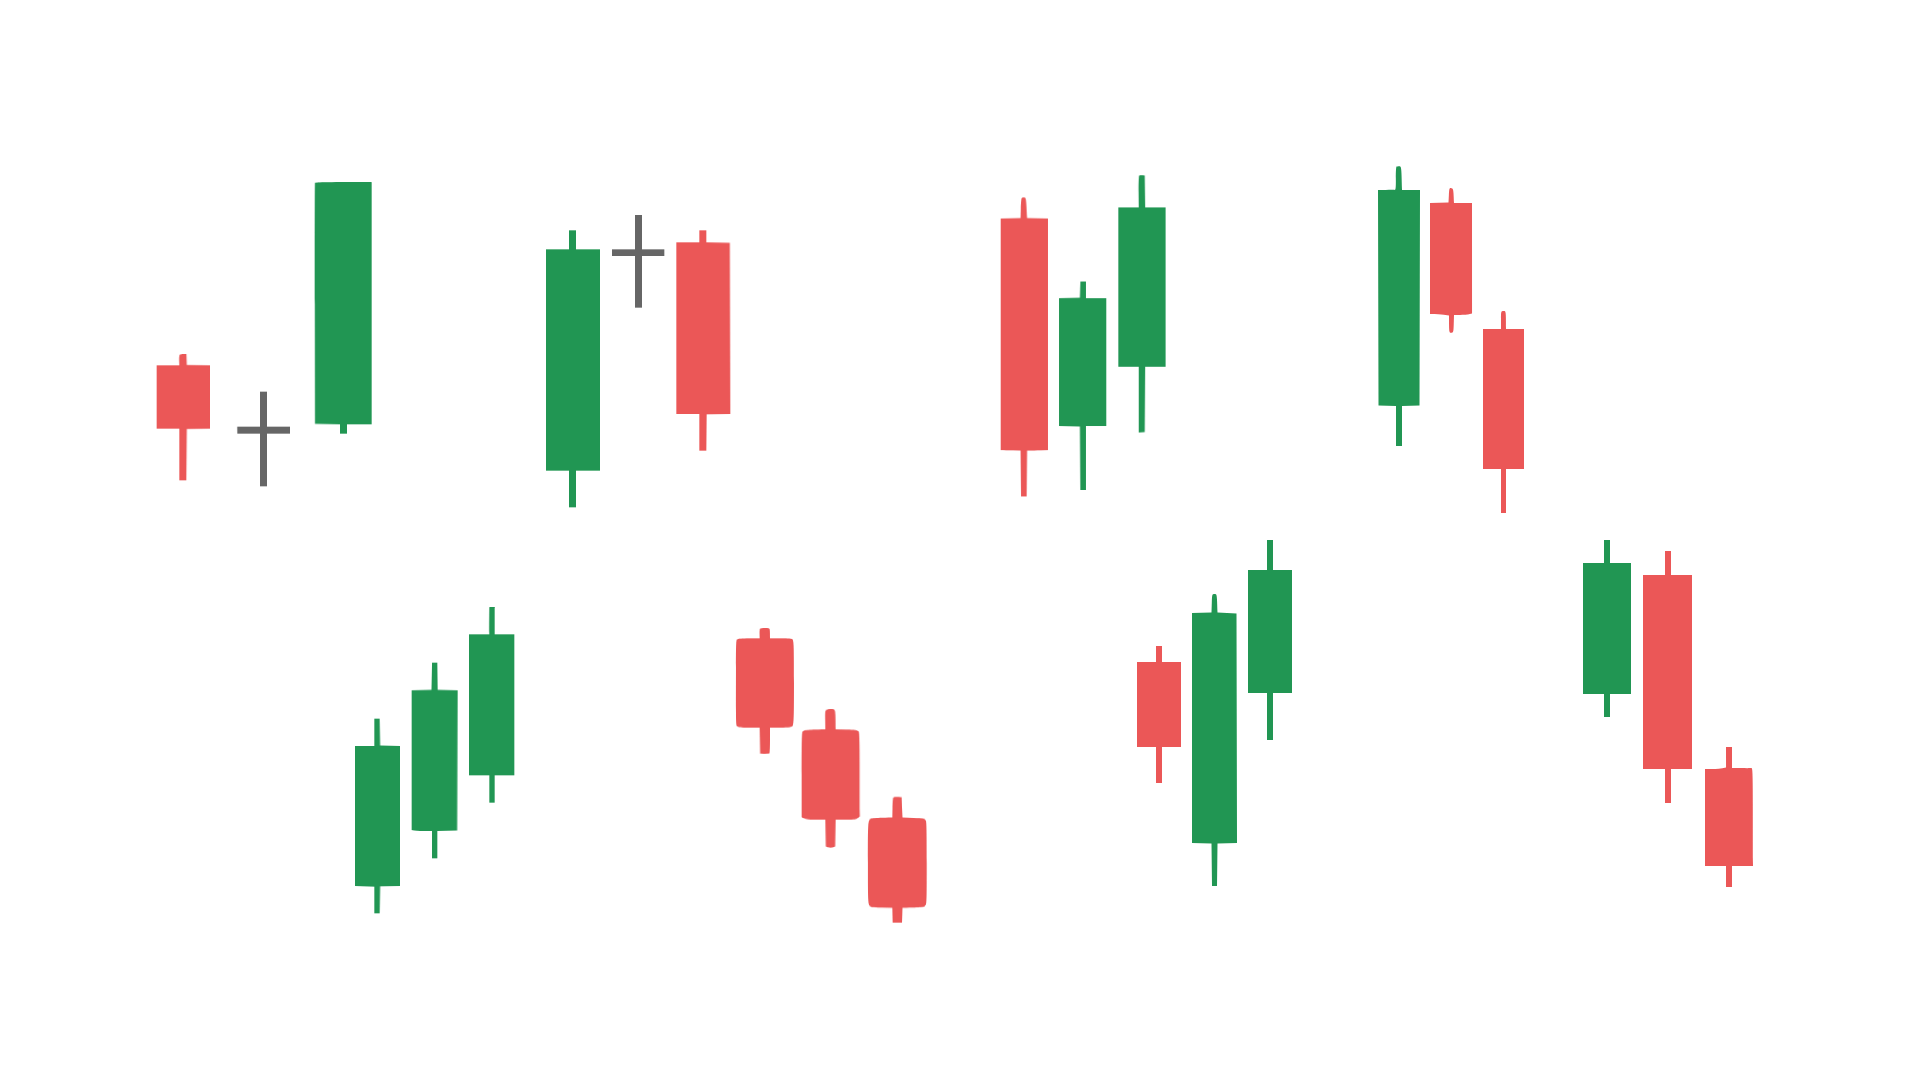
Due to spanning over three sessions, three-candle patterns demand a bit more patience, but that patience is the point. You’re forcing the market to prove itself across multiple sessions, which naturally reduces impulsive entries and filters a lot of noise.
Candlestick patterns typically achieve 60–70% effectiveness when properly confirmed through complementary signals. The patterns below gain strength when paired with volume analysis, support/resistance breaks, and indicator alignment.
Morning Star
What it is (3-candle rule)
- Candle 1: Strong bearish candle with a large real body, appearing during a downtrend
- Candle 2: Small-bodied "star" candle (can be bullish or bearish) that gaps down, showing indecision
- Candle 3: Strong bullish candle that closes at least halfway into Candle 1's real body, signaling buyers have regained control
Where it works best This bullish pattern performs strongest near established support zones after a sustained downtrend.
What invalidates it
- Candle 3 fails to close above the midpoint of Candle 1's body
- Candle 2's real body is too large (similar size to Candle 1)
- Candle 3 shows weak bullish momentum with long upper wick rejection
- Pattern forms mid-downtrend without approaching support
Common lookalikes Morning Doji Star shares the same structure, but requires Candle 2 to be a true doji.
Fast confirmation checklist
Three White Soldiers
What it is (3-candle rule)
- Candle 1: Strong bullish candle with minimal upper wick
- Candle 2: Bullish candle that opens within Candle 1's body and closes higher
- Candle 3: Bullish candle that opens within Candle 2's body and closes higher, maintaining the progression
Quality filter: long upper wicks or small real bodies.
Where it works best: Strong after a pullback to support during an uptrend, or at the start of a new uptrend from a base.
What invalidates it
- Any candle shows a bearish close
- Candles open below the previous candle's body
- Long upper wicks appear on multiple candles
- Pattern forms after an extended rally
Common lookalikes Three Inside Up requires an initial harami setup; Three White Soldiers does not.
Fast confirmation checklist
Evening Star
What it is (3-candle rule)
- Candle 1: Strong bullish candle during an uptrend
- Candle 2: Small-bodied star candle (bullish or bearish) that gaps up, showing indecision
- Candle 3: Strong bearish candle that closes at least halfway into Candle 1's real body
Where it works best Near established resistance zones after sustained uptrends.
What invalidates it
- Candle 3 fails to close below the midpoint of Candle 1's body
- Candle 2's body is too large relative to Candle 1
- Candle 3 shows weak bearish pressure with long lower wick
- Pattern forms mid-uptrend without approaching resistance
Common lookalikes Evening Doji Star requires Candle 2 to be a pure doji.
Fast confirmation checklist
Three Black Crows
What it is (3-candle rule)
- Candle 1: Strong bearish candle with minimal lower wick
- Candle 2: Bearish candle that opens within Candle 1's body and closes lower
- Candle 3: Bearish candle that opens within Candle 2's body and closes lower
Quality filter: Reject long lower wicks and small bodies.
Where it works best: After a bounce to resistance during a downtrend, or at the start of a new decline from a top.
What invalidates it
- Any candle closes bullish
- Candles open above the previous candle's body
- Long lower wicks appear across multiple candles
- Pattern develops after an extended decline
Common lookalikes: Three Inside Down starts with a harami formation.
Fast confirmation checklist
Three Inside Up
In both directions, these patterns start with a harami setup, confirmed by the final third candle in a pattern. Inside Up is set up with a bullish harami, Inside Down starts with a bearish harami.
What it is (3-candle rule)
- Candle 1: Bearish candle in a downtrend
- Candle 2: Smaller bullish candle inside Candle 1's real body (harami)
- Candle 3: Bullish candle that closes above Candle 1's high
Where it works best Near support zones where the harami signals stalling sellers.
What invalidates it
- Candle 2 extends beyond Candle 1's real body boundaries
- Candle 3 fails to close above Candle 1's high
- Candle 3 shows weak bullish momentum
- Pattern forms without approaching support
Fast confirmation checklist
Three Outside Down
If Inside patterns start with harami setups, the main difference of Outside patterns is engulfing two-candle patterns as a setup. Outside Down shifts bearish, Up is bullish.
What it is (3-candle rule)
- Candle 1: Bullish candle in an uptrend
- Candle 2: Bearish engulfing candle
- Candle 3: Bearish candle that closes below Candle 1's low
Where it works best Near resistance zones where buyers begin to stall.
What invalidates it
- Candle 2 breaks outside Candle 1's real body range
- Candle 3 fails to close below Candle 1's low
- Candle 3 displays weak bullish pressure with long upper wick
- Pattern develops without nearing resistance
Fast confirmation checklist
Confirmation Signals
Photo by Maxim Hopman on Unsplash
Candlestick patterns require confirmation signals—additional evidence from volume, support/resistance, indicators, and timeframe alignment—to filter out false setups and improve the reliability of trade decisions before entry. Proper confirmation makes sure you’re acting because multiple independent factors align.
We’ve already covered what substantiates the patterns; now, it’s about time to review how these manifest in charts and what signals to check.
Confirmation Checklist
Before entering a trade based on any candlestick pattern, verify at least three of the following conditions:
- Volume expansion on the confirmation candle exceeds the pattern's internal candles or recent average.
- Support or resistance proximity places the pattern at a validated level with prior touches or role reversal.
- One indicator alignment from momentum, trend, or volatility families supports the pattern's directional bias.
- Higher timeframe agreement shows no conflicting trend or structure that would invalidate the setup.
- Close positioning relative to the pattern's body and key levels confirms acceptance or rejection.
- Lower timeframe trigger displays clean follow-through or retest behavior without excessive noise.
- Absence of disqualifying signals such as low-volume breakouts, lagging indicators, or conflicting closes.
Volume
Volume is your most tangible validator. Candles show where price went; volume hints at how serious the market was about going there.
- Volume expansion on the confirmation candle suggests real participation.
- Volume climax or spike can mean capitulation in reversals, but can warn of fake-outs in continuation patterns.
- Low-volume breakouts are red flags; breakout + retest with improved volume is more solid.
- Relative volume versus a simple baseline (10–20 candles) gives the quick “market cares / market doesn’t care” context.
Volume at market open/close or pre-news can be deceptive. If a pattern forms during these windows with unusual volume, wait for the next session’s close to confirm.
Support and Resistance
Support and resistance provides the “map” that makes patterns tradable. A pattern mid-range is usually just a shape; a pattern interacting with a validated level is a signal you can plan around.
- Reversal pattern forming at support with a clear rejection wick is high-quality confluence.
- Bearish signal forming into resistance after a rally is the mirror setup.
- Breakout + retest structure is where candlestick confirmation becomes especially useful.
- Micro-rule: the close relative to the level matters—clean acceptance/rejection beats “hovering.”
Indicators
Indicators should confirm price action, not justify a weak setup.
- Momentum family (e.g., RSI-like oscillators): look for divergence and reversals from overextension.
- Trend family (e.g., moving-average-like tools): align with the prevailing bias.
- Volatility family (e.g., ATR-like or bands-like tools): manage expectations about retracements and overextension.
Confirmation and justification are two different things, by the way. You should not be looking for reasons a weak pattern might work but instead compound valid indicators to make the decision.
Multi-Timeframe Alignment
Use a three-tier workflow:
- Higher timeframe: define trend and key levels.
- Trading timeframe: evaluate the pattern at those levels.
- Lower timeframe: refine entry timing and retests.
Conflict resolution rule 1: If a higher timeframe disagrees, skip, reduce size, or demand stronger confirmation.
Conflict resolution rule 2: If the lower timeframe is noisy, don’t let it override the trading timeframe close and level interaction.
Trade Planning and Risk Management

Entries
A clean entry rule keeps you out of emotional trades. Aggressive traders enter at the signal candle close; conservative traders wait for next-candle confirmation. Whichever you choose, keep triggers objective:
- Close beyond the prior candle’s high/low
- Break-and-close beyond a mapped support/resistance level
- Reclaim/loss of a key swing point
Avoid entries when the candle is low-range, when the setup runs directly into nearby resistance/support, or when the structure offers poor reward.
Stops
Stops define invalidation, not discomfort thresholds. Stop-loss placement defines your trade’s invalidation point—the price level where the candlestick pattern’s premise breaks and continuing to hold the position no longer makes logical sense.
Three distinct placement methods:
1. Candle-structure stop (pattern-specific):
Place the stop 1–2 ticks (or 0.1–0.3% in percentage markets) beyond the signal candle’s extreme—below the low for long entries, above the high for shorts. Use this method when the pattern is clean, timeframe context is aligned, and no major support or resistance sits nearby.
- When to use: Single-candle reversals like hammers, shooting stars, or engulfing patterns on lower timeframes (5-min to 1-hour).
- Main risk: Whipsaws during volatile sessions can trigger stops via brief wick penetrations before price resumes the intended direction.
- Precise rule: For a bullish hammer at $1,200 with a low of $1,195, set stop at $1,194.50 (0.5 point buffer).
2. Swing-structure stop (context-aware):
Place the stop beyond the most recent swing low (longs) or swing high (shorts) that aligns with nearby support or resistance, even if it sits further than the signal candle’s extreme. Use this when trading off higher timeframes (4-hour, daily) or when the signal candle formed near a well-tested level.
- When to use: Multi-candle confirmations (e.g., morning star at demand zone) or when prior swing points define clear market structure.
- Main risk: Wider stops reduce position size; if the swing is too far from entry, the trade may not meet minimum reward-to-risk criteria.
- Precise rule: Bullish engulfing at $48 near support at $46; prior swing low = $45.80. Stop goes at $45.70, even though the engulfing candle’s low was $47.50.
3. Volatility-buffer stop (ATR-adjusted):
Combine the candle or swing structure stop with a volatility cushion derived from Average True Range (ATR). Add 0.5× to 1× ATR to the structural level to avoid normal price noise triggering premature exits.
- When to use: High-volatility environments (ATR spiking above historical average) or after gaps/news events that expand candle ranges.
- Main risk: Excessively wide stops can make position sizing impractical; if ATR adjustment pushes risk beyond 2%, skip the trade.
- Precise rule: Structural stop below doji low at $100; ATR = $2.00. Final stop = $100 - (1 × $2.00) = $98, assuming normal volatility; increase buffer to 1.5× ATR if the prior session showed erratic swings.
Take-Profit Planning
Take-profit planning converts your candlestick entry into realized gains by predefining exit points that balance probabilistic profit-taking with structural logic. Two frameworks work in tandem: R-multiple targets provide mechanically scalable exits based on your initial risk, while structure-based targets anchor profit zones to genuine resistance, support, and measured moves where price action historically stalls or reverses.

Framework 1: R-multiple targets
“R” equals your initial risk—the dollar or percentage distance from entry to stop-loss. A 2R target means you aim to capture twice that distance in profit. If your stop sits $50 below entry, 2R = $100 above entry. R-multiples offer consistency: every trade uses the same reward-to-risk baseline (e.g., minimum 2R), preventing you from accepting unfavorable setups where nearby resistance caps upside before meaningful profit appears.
Framework 2: Structure-based targets
Structure-based exits use the next significant resistance (for longs) or support (for shorts), prior swing highs/lows, or measured moves projected from the pattern’s range. A bullish engulfing off support at $1,000 might target the prior swing high at $1,080, or a measured move equal to the engulfing candle’s range ($40) added to the breakout point.
Choosing between frameworks (worked example):
Entry on bullish pin bar at $200; stop below pin bar low at $195; initial risk (R) = $5.
- 2R target = $200 + (2 × $5) = $210.
- Nearest resistance sits at $208 (prior consolidation zone).
Decision rule: If the structural level ($208) sits closer than your R-multiple target ($210), either take partial profits at structure and let the remainder run to 2R, tighten expectations and accept 1.6R as your realistic target, or skip the trade entirely if the compressed reward-to-risk no longer justifies the setup. In this case, $208 delivers 1.6R ($8 profit ÷ $5 risk), which remains acceptable if the pattern quality is high and you plan to scale out.
When structure significantly exceeds your R-target (e.g., resistance at $220 when 2R = $210), use the R-level for partial profit-taking and trail stops toward the structural target.
Position Sizing
Position sizing protects the account when patterns fail (and they will, 20 to 30% of the time).
Position Size = (Account Risk, denominated in $) ÷ (Entry − Stop)
Cap correlated exposure and reduce per-trade risk during high volatility regimes.
Common Risk Management Failure Modes:
- Entering without confirmation
- Placing stops inside the noise
- Targeting into immediate resistance/support
- Ignoring time-of-day liquidity
- Confusing pattern validity with market structure
- Oversizing on "high-conviction" setups
Even strong candlestick patterns tend to work only 60–70% of the time when properly confirmed, which is exactly why stops and sizing are not optional (Source).
Key Considerations and Risks
Candlestick patterns improve trading decisions when properly applied, but they are probabilistic tools—not guarantees—and understanding when they fail is as critical as recognizing them.
False Signals and Choppy Markets is where patterns go to die: overlapping bodies, erratic wicks, and no follow-through. Avoid or reduce risk when you see overlapping bodies across 5+ bars, wick-to-body ratios above 2:1 across multiple candles, or volume declining during pattern formation.
Furthermore, liquidity and execution realities can distort candles and ruin otherwise clean setups:
- Liquidity affects wick formation and fills.
- Spread erodes edge, especially for short-duration setups.
- Slippage turns “planned risk” into “actual risk.”
- Although not too relevant to crypto, gaps skip price levels and can invalidate patterns instantly.
Pre-trade liquidity checklist:
- Average volume vs 20-day average
- Spread vs typical levels
- Limit orders for entries, market orders only when urgency justifies slippage
- Stop buffer using ATR or typical wick size
- Avoid first/last 15 minutes (or equivalent low-liquidity troughs) of the day

Scheduled and unscheduled catalysts (news, earnings, and volatility spikes) can override technical setups. Day traders should avoid new entries within 24 hours of high-impact releases; reduce size if holding. For swing traders, exits should be planned before the event or until after post-event closes.
Treat patterns containing a volatility expansion candle as suspect until confirmed by at least two normal-volatility candles.
Studying market psychology is subject to biases, such as overfitting and data-snooping that produce fragile strategies. There are many guardrails: pre-register rule definitions, separate train/test data, include transaction costs and slippage, avoid look-ahead bias, validate across regimes and instruments, and track live forward performance.
Candlestick Pattern Cheat Sheet
Candlestick pattern recognition needs speed, but trading needs structure. Use the table to identify, then the confirmation rules to decide.
Use this table as a quick signal reference; confirmations are mandatory. Properly confirmed candlestick patterns tend to work about 60–70% of the time, and results vary significantly when confirmations are skipped.
| Pattern Name | Bullish/Bearish/Neutral | Typical Market Context | What the Shape Signals | Minimum Confirmation Checklist | Common Failure Mode | Suggested Risk-Management Note |
|---|---|---|---|---|---|---|
| (1) Single Candlestick | ||||||
| Hammer | Bullish | Downtrend with defined support | Rejection at lower prices; buyers stepped in | • Volume spike on formation day • Next candle closes above Hammer high • RSI shows divergence | Choppy consolidation with no clear support | Place stop loss 5-10 pips below Lower Wick; avoid trading if Upper Wick > 20% of total height |
| Shooting Star | Bearish | Uptrend near resistance | Rejection at higher prices; sellers dominated | • Upper Wick ≥ 2x Real Body length • Next candle closes below Shooting Star low • Volume confirms distribution | News spike causing temporary rejection without trend shift | Conservative stop loss just above Upper Wick tip; reduce size if price near round numbers |
| Doji (Standard) | Neutral (context-dependent) | Any trend, most potent at reversals | Indecision; equal buying/selling pressure | • Appears at key support/resistance • Higher-timeframe trend alignment • Subsequent candle provides directional clarity | Low liquidity causing random Doji formation | Wait for confirmation candle before entry; avoid trading during earnings/FOMC |
| Long-Legged Doji | Neutral (high volatility warning) | Trend exhaustion or consolidation | Extreme indecision with wide price swings | • Wicks extend ≥ 3x Real Body • Volume expansion during session • Price near multi-month highs/lows | Whipsaw continuation; market remains rangebound | Tighten stops to 50% of wick length; expect breakout within 1-3 sessions |
| Dragonfly Doji | Bullish | Downtrend at support | Strong rejection of lows; no upper price testing | • Long Lower Wick (≥ 70% of range) • Minimal/no Upper Wick • Volume surge on intraday low | False signal in accelerating downtrend | Stop loss below Dragonfly low; confirm with bullish engulfing or volume follow-through |
| Gravestone Doji | Bearish | Uptrend at resistance | Strong rejection of highs; no lower price acceptance | • Long Upper Wick (≥ 70% of range) • Minimal/no Lower Wick • Distribution volume pattern | Low-liquidity spike causing temporary wick | Stop loss above Gravestone high; pair with overbought RSI (> 70) for higher conviction |
| (2) Two-Candlestick Patterns | ||||||
| Bullish Engulfing | Bullish | Downtrend or retracement to support | Complete reversal of prior pessimism | • Second Real Body engulfs first entirely • Volume on second candle > 20-day avg • Appears at tested support zone | Engulfing during flat consolidation with no directional bias | Entry on break of Engulfing high; stop loss below pattern low with 1:2 R minimum |
| Bearish Engulfing | Bearish | Uptrend or rally to resistance | Complete negation of prior optimism | • Second Real Body engulfs first entirely • Increased volume on bearish candle • Pattern at overextended resistance | Engulfing in sideways chop; no clear trend context | Entry below Engulfing low; target prior swing low with conservative position size |
| Piercing Line | Bullish | Downtrend with panic-selling exhaustion | Partial reversal; buyers reclaim > 50% of prior loss | • Second candle closes above 50% of first's Real Body • Gap down on second open • Volume expansion confirms accumulation | Closes at exactly 50%; lacks conviction without follow-through | Stop loss below second candle's low; avoid if pattern appears mid-range |
| Dark Cloud Cover | Bearish | Uptrend showing first signs of weakness | Partial reversal; sellers reclaim > 50% of prior gain | • Second candle opens above first's high • Closes below 50% of first's Real Body • Distribution volume present | Appears far from resistance; lacks structural context | Stop loss above second candle's high; confirm with next-day bearish continuation |
| (3) Three-Candlestick Patterns | ||||||
| Morning Star | Bullish | Established downtrend at major support | Trend exhaustion → indecision → reversal confirmation | • Middle candle small-bodied (Doji ideal) • Third candle closes well into first's Real Body • Volume progression: low → moderate → high | Middle candle too large; signals continuation not reversal | Entry above third candle high; stop loss below pattern low; scale in if hesitation follows |
| Evening Star | Bearish | Extended uptrend at resistance | Euphoria exhaustion → uncertainty → rejection | • Middle candle gaps away from first • Third candle closes deep into first's Real Body • Volume confirms distribution on third candle | Middle candle lacks gap; reduces reliability | Entry below third candle low; stop loss above pattern high; watch for bull trap fake-out |
| Three White Soldiers | Bullish (strong continuation) | Recovering from downtrend or breaking resistance | Sustained buying pressure; consistent advances | • Each candle closes near session high • Minimal Upper Wicks • Volume steady or increasing across all three | Appears after extended rally; potential exhaustion signal | Trail stop loss below most recent candle's low; avoid initiating new longs if RSI > 75 |
| Three Black Crows | Bearish (strong continuation) | Breakdown from uptrend or support failure | Relentless selling; no Lower Wick support | • Each candle closes near session low • Minimal Lower Wicks • Volume expands or remains elevated | Pattern in deep oversold; may signal capitulation bottom | Trail stop loss above most recent candle's high; reduce size if pattern forms on heavy news |
Conclusion
Candlestick patterns function as probabilistic signals that identify potential price reversals or continuations, not guarantees of future movement. Their effectiveness depends entirely on context—trend direction, volume behavior, support and resistance zones—and demands confirmation from additional technical indicators before entry. Without proper risk controls like stop-loss orders and position sizing rules, even high-probability setups can result in outsized losses during volatile market conditions or news-driven price swings.
Frequently Asked Questions
What success rate should I expect from candlestick patterns?
It depends on your confirmation rules and market conditions. Properly confirmed patterns may achieve 60–70% success rates in favorable setups, according to research from professional trading communities like The Chart Guys. However, these figures assume you're filtering trades by trend context, volume analysis, and support/resistance alignment. In choppy or low-liquidity markets, win rates drop significantly—sometimes below 50%—which is why risk management remains mandatory regardless of historical performance. Track every trade in a journal to calculate your personal expectancy (average win size minus average loss size multiplied by win rate) rather than relying on generic statistics. Remember that a 55% win rate with proper risk-reward ratios can still generate consistent profits, while a 70% win rate with poor position sizing can drain your account.
How do reversal patterns differ from continuation patterns?
Reversal patterns—like Hammer, Shooting Star, or Engulfing candles—signal potential trend exhaustion and appear near support or resistance zones. Continuation patterns, such as Rising Three Methods or Falling Three Methods, suggest the existing trend will resume after a brief pause. The critical difference lies in where you encounter them: if a Bullish Engulfing forms at a major support level after a downtrend, it's a reversal candidate; the same pattern mid-uptrend near no significant resistance acts as continuation confirmation. To apply this correctly, reference the Trend Context section of this guide to identify whether you're in an uptrend, downtrend, or range. Then cross-check the Confirmation Signals section to verify volume spikes and indicator agreement before entering. Never trade a pattern in isolation—always ask "Where in the trend am I?" and "What's nearby on the chart?"
What timeframe works best for candlestick patterns?
It depends on your trading style and holding period. Day traders typically use 5-minute to 15-minute charts as their primary timeframe, checking the 1-hour chart for trend context. Swing traders focus on 1-hour to 4-hour candles, using the daily chart for multi-timeframe alignment. Position traders analyze daily and weekly timeframes, referencing monthly charts to avoid counter-trend noise. The golden rule: choose one primary timeframe where you'll identify patterns, then confirm on one higher timeframe to ensure you're not fighting the broader trend. For example, if a Hammer appears on a 15-minute chart during a downtrend on the 1-hour chart, the pattern's reversal potential is compromised. Multi-timeframe alignment prevents this trap by forcing you to respect the larger market structure before committing capital to any single Candlestick signal.
What counts as confirmation for a candlestick pattern?
Confirmation requires agreement across three independent categories. First, volume behavior: a Bullish Engulfing candle should arrive with above-average volume on the green candle, signaling genuine buying pressure rather than low-liquidity noise. Second, location at support or resistance: patterns gain reliability when they form at pre-identified horizontal levels, trendlines, or Fibonacci retracement zones where buyers or sellers historically defended price. Third, indicator agreement: if a Hammer appears while RSI exits oversold territory or MACD prints a bullish crossover, those technical signals corroborate the pattern's reversal thesis. These categories are non-overlapping—you can have volume confirmation without indicator agreement, or vice versa. Reference the Confirmation Signals subsections in this article for detailed examples of each category. Never enter a trade based solely on the candle's shape; stack at least two of these three confirmation types to filter out false signals.
How do I set entries, stops, and targets using a pattern?
Use the pattern's wick extremes and Real Body to define your trade parameters. For a Bullish Hammer, place your entry above the Real Body's close, set your stop loss just below the Lower Wick's low (the pattern's invalidation level), and target a move equal to 1.5× to 2× the risk (stop distance). For example, if the Hammer's low is $48 and your entry is $50, your stop sits at $47.50 (risking $2.50 per share), and your target extends to $53.75 or higher. One critical pitfall: setting stops too tight in high-volatility environments or markets prone to gaps (like earnings releases in equities). Normal price fluctuations will stop you out prematurely even if the pattern's thesis remains valid. The remedy is position sizing adjustment—risk a smaller percentage of capital (0.5% instead of 1%) and widen the stop to accommodate realistic volatility, using ATR (Average True Range) as a guide for stop placement distance.
Why do candlestick patterns fail?
Patterns fail when market conditions violate the assumptions behind them. First, choppy or sideways markets: Candlestick signals depend on directional momentum; in tight ranges, patterns generate false signals because neither bulls nor bears control price. Diagnostic cue: if the 20-period moving average is flat and price oscillates within a narrow band, avoid pattern-based trades. Second, low liquidity and slippage: thin order books cause erratic price action that produces candle shapes resembling patterns but lacking institutional participation. Cue: check volume—if it's below the 20-day average, skip the trade. Third, news and earnings volatility spikes: unexpected announcements override technical setups entirely. Cue: consult an economic calendar and avoid trading patterns 24 hours before/after major releases. Fourth, pattern traps and overfitting: seeing patterns everywhere because you're conditioned to find them. Cue: require confirmation from multiple sources before acting, and maintain a trading journal to identify if you're overtrading low-quality setups.
Are some patterns more reliable than others?
It depends on how you define "reliable"—hit rate (percentage of winning trades) differs from expectancy (average profit per trade). A pattern with a 65% win rate but small average gains may underperform one with a 55% win rate and large average wins when combined with proper risk-reward ratios. The only way to determine reliability in your hands is to track results in a trading journal: log every trade's pattern type, confirmation signals used, outcome, and profit/loss. After 50+ trades, calculate both hit rate and expectancy to see which setups work for your execution style. Beware of data-snooping bias—if you cherry-pick timeframes or markets where a pattern performed well historically, you're likely overfitting to noise. Instead, apply consistent confirmation rules across all patterns and let your journal reveal which setups align with your strengths. No pattern is universally superior; reliability emerges from disciplined application, not the pattern itself.
Do candlestick patterns work in crypto, forex, and stocks?
Yes, but applicability depends on liquidity, trading hours, and volatility characteristics. In equities, patterns work best on high-volume stocks because liquidity ensures price action reflects genuine supply-demand shifts; however, you must account for earnings gaps—overnight price jumps that invalidate patterns formed near the close. In forex, 24/7 trading sessions eliminate gap risk but introduce challenges around major session overlaps (London/New York) where volatility spikes distort candle shapes. In crypto, patterns apply across all timeframes thanks to continuous trading, but extreme volatility means confirmation signals (volume analysis, support/resistance) carry extra weight—a Doji in Bitcoin during low weekend volume may be meaningless, while the same pattern during high weekday volume at a key level deserves attention. One market-specific adaptation: in crypto, always check whether a pattern forms during your region's active trading hours or during low-liquidity overnight periods; the latter produces more false signals.
What is the single biggest beginner mistake with candlestick patterns?
Trading patterns without context or confirmation. Beginners see a Hammer or Engulfing candle and immediately enter, ignoring trend direction, nearby support/resistance, and volume behavior. The corrective mini-checklist: (1) Identify the prevailing trend—are you trading with or against it? (2) Check location—does the pattern sit at a meaningful support, resistance, or Fibonacci level? (3) Require confirmation—does volume support the move, and do at least two indicators agree? If any step fails, skip the setup.
What are real body, wicks, and doji?
Real Body: the rectangular section of a Candlestick, representing the range between the opening and closing prices; green (or white) bodies indicate closes above opens, while red (or black) bodies show closes below opens. Upper Wick: the thin line extending above the Real Body, marking the period's highest price before sellers pushed it back down. Lower Wick: the thin line below the Real Body, showing the lowest price reached before buyers drove it higher. Doji: a candle with virtually no Real Body—open and close are nearly identical—signaling indecision as neither buyers nor sellers gained control; often appears at potential reversal points when combined with volume analysis and trend context.