Contents
Reading the crypto news, you could have come across phrases like “Bitcoin’s best month to date” or “red month”. Likewise, browsing the analytical tools, you may have seen tables of green and red cells or overlapping price charts. Well, in this guide, I’ll demystify the seasonality tools and show how you can utilize them for your strategies!
Key Takeaways
- Seasonal tendency, seasonality or seasonal returns charts, used for Bitcoin as well, refer to charts or tables that demonstrate the historic price change over certain recurring time periods. They help pay attention to certain trends tied to seasons and can be useful for investment planning long-term trading.
- A line seasonality chart for BTC shows its percentage price change over a given period, overlapping with its performance in repeating time frames. With this chart, traders can analyze seasonal volatility trends or more clearly see when trends start and end.
- Bitcoin’s seasonal returns calendar is a matrix with each cell representing a period, colored according to whether BTC rose or fell during it. In contrast to a line chart, it lets investors analyze historic profitability of a season at a glance.
Seasonal Tendency Charts and How to Use Them
The name “seasonality” or “seasonal tendency” implies that every season, a trend or another pattern seems to happen. In this case, season would mean the same time of the year.
So, a seasonality chart is a tool to visualize the typical performance of an asset during specific time periods. They are rather elegant tools, easy to make and to grasp: visualize the price performance with a line chart or a table cell and place it alongside the same indicators to compare.
Bitcoin has been trading for more than a decade now, meaning there is enough data to compare its regularly occurring tendencies during the years. Be it a line chart for price history or a table with years in rows, there are already some apparent trends revealed by these tools.
What is the point of a seasonal returns chart?
These charts belong in the historical analysis toolkit. In general, you use it to project past performance and behaviors onto future possibilities, although only to assess their likelihood.
There is a huge variety of ways a Bitcoin trader and holder can make use of a seasonality chart. One of them is identifying historically good or bad periods to enter, exit or hold through. As a result, you can better manage risks in your positions or make use of more opportunities.
Historical analysis with seasonal tendency charts can also help you evaluate probabilities of price movements or even spot anomalies in price action. For instance, September on average sees even more loss but October is historically green, meaning that you might want to hold through or even buy the dip before it rises the next month. However, this is not always the case, as in October 2018 BTC lost even more in comparison to September 2018. As for irregularities, if you had known March is historically not great for BTC and had not been spooked by the Bloody Friday of March 13, 2020, when it lost almost a quarter of its value, you could see a good gain as soon as in April: a $ 10,000 investment in BTC on March 17, 2020 would have grown to almost $19,000 in 30 days.
How Does a BTC Seasonality Chart Look Like?
If you are not familiar with these tools, it might be hard to picture what we are talking about. So let’s review them so you have a better idea!
Line Seasonality Chart
This chart displays Bitcoin’s performance (usually in averages) throughout a specific period: a month, quarter, or year. The horizontal axis represents time progression within the period, while the vertical axis shows the percentage gain/loss in bitcoins. The point of these charts is to overlay multiple years/quarters/months or show an average line with standard deviation bands to illustrate both the pattern and its consistency.

The BTC seasonality chart above shows Bitcoin’s price performance for every year, starting with 2020. The lines are labeled on the right with the year and returns scored at the end of each. You can see some recurring trends by comparing the overlapping charts, like the rise in BTC prices around October (which did not happen only in 2022).
Seasonal Returns Calendar
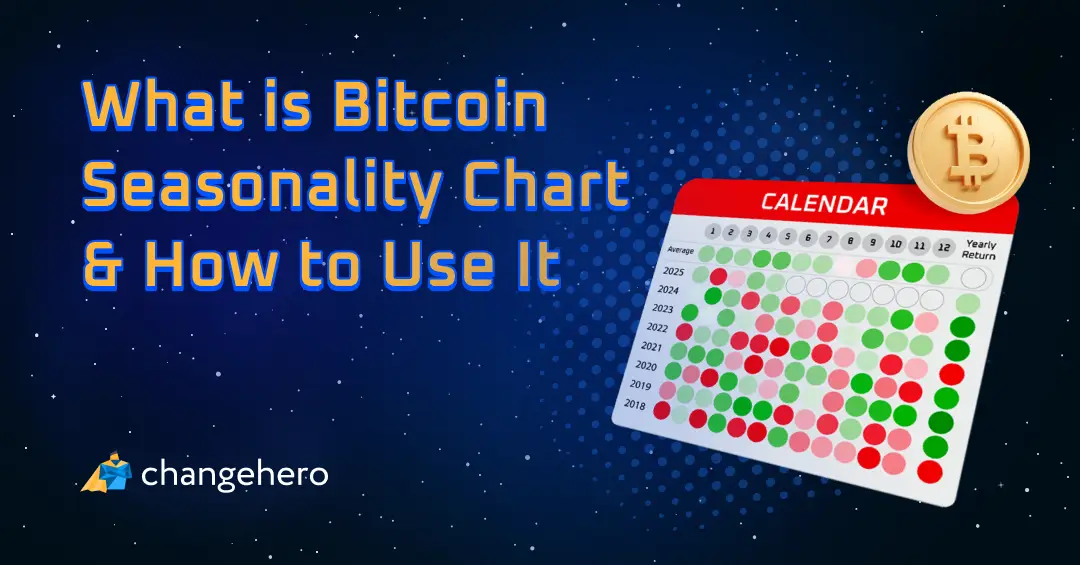
Another format to present similar recurring trends is a calendar or BTC monthly returns table. It summarizes the Bitcoin historical performance by month in a heatmap-like format. Each cell represents a specific time period (day, week, or month) and is color-coded based on average returns. The most common color code for this is green for positive returns and red for negative returns, sometimes with intensity corresponding to the magnitude of returns.

This BTC monthly returns chart places years on the rows and months in columns, with a rightmost column summarizing the yearly change. This type of visualization makes it easier to identify which months or periods have historically been strongest or weakest for Bitcoin.
How to Use These Charts in Practice
It’s not just a couple of differences in presentation: despite tracking similar data, a BTC calendar and a seasonality line chart have varying practical applications.
Line Seasonality Chart Uses
Line charts are better to visualize trends with more granularity rather than the average result. With those, you can more precisely determine for how long to hold BTC or have a position open. It also gives you a better idea of how volatility changes during a given season.
More clarity into direction change along with the trend intensity should be helpful when planning entry and exit. A calendar will show you trends better at a glance but with a line chart, you will also see them in perspective and within the context of volatility.
Seasonal Returns Calendar Uses
On the other hand, for long holding cycles, when you do not really care about volatility in a given moment, a Bitcoin monthly returns table that summarizes the gist may be the better tool. When you plan your taxes, you would rather immediately know whether BTC rises or falls in a certain month than what trajectory it follows.
Certain investment strategies like dollar-cost averaging also would get more use out of a table. Since in this strategy the degree of the price change is irrelevant, you can more quickly pinpoint a favorable period to enter.
Conclusion
Learning that Bitcoin follows certain trends depending on the time of the year might be surprising but there is evidence that backs this up. Using this know-how, along with other analytical tools, can help you step up the game so your gains grow way beyond some pocket change to buy pizzas with!
Browse the ChangeHero blog to get to know the crypto world better. Subscribe to us on social media to stay tuned to the updates: we’re on X, Facebook, and Telegram.
Frequently Asked Questions
What is Bitcoin month?
In a Bitcoin-related context, as in finance, a month is considered to always be 30 days to avoid inconsistency due to calendar months being shorter or longer. When you read “Bitcoin’s green month” or “red month”, what does it mean? It refers to whether a given 30-day period saw Bitcoin’s price rise or fall. On trading charts and in other visual references, green usually means profits and red means loss.
Are Bitcoin seasonality patterns reliable?
Like many other trading analytical tools, on their own these charts or tables cannot serve as a reliable reference point for investment decisions. Seasonality patterns only visualize statistical tendencies from the past data, although it is true that their reliability slowly increases as more of it becomes available.
Do BTC seasonal patterns change over time?
Yes! They can change due to the market maturing or macroeconomic factors coming into play. This is another reason why even large amounts of historic data may fail to predict future trends.
Can you use seasonality charts for Bitcoin price prediction?
Although historic analysis is often used to help project BTC’s path in certain seasons, this is far from an infallible tool. The best it can do is highlight a certain trend (summer lows, Christmas surges) that may or may not take place in the foreseeable future.